


Congressional District 1, Louisiana
About
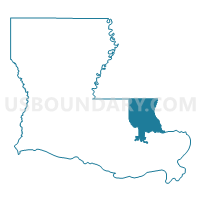
Outline

Summary
| Unique Area Identifier | 118884 |
| Name | Congressional District 1 |
| State | Louisiana |
| Area (square miles) | 2,840.06 |
| Land Area (square miles) | 2,392.76 |
| Water Area (square miles) | 447.30 |
| % of Land Area | 84.25 |
| % of Water Area | 15.75 |
| Latitude of the Internal Point | 30.55217430 |
| Longtitude of the Internal Point | -90.13090840 |
| Total Population | 686,961 |
| Total Housing Units | 300,921 |
| Total Households | 271,369 |
| Median Age | 38.8 |
Maps

Graphs
Select a template below for downloading or customizing gragh for Congressional District 1, Louisiana


Neighbors
Neighoring 111th Congressional District (by Name) Neighboring 111th Congressional District on the Map
- Congressional District 2, LA
- Congressional District 3, LA
- Congressional District 3, MS
- Congressional District 4, MS
- Congressional District 6, LA
Top 10 Neighboring County (by Population) Neighboring County on the Map
- Jefferson Parish, LA (432,552)
- Orleans Parish, LA (343,829)
- St. Tammany Parish, LA (233,740)
- Livingston Parish, LA (128,026)
- Tangipahoa Parish, LA (121,097)
- Pearl River County, MS (55,834)
- St. Charles Parish, LA (52,780)
- Washington Parish, LA (47,168)
- St. John the Baptist Parish, LA (45,924)
- Hancock County, MS (43,929)
Top 10 Neighboring County Subdivision (by Population) Neighboring County Subdivision on the Map
- New Orleans city, Orleans Parish, LA (343,829)
- District 1, Jefferson Parish, LA (92,049)
- District 5, Jefferson Parish, LA (91,268)
- District 4, Jefferson Parish, LA (89,653)
- District 2, Jefferson Parish, LA (81,272)
- District 3, Jefferson Parish, LA (78,310)
- District 1, St. Tammany Parish, LA (24,084)
- District 7, St. Tammany Parish, LA (20,017)
- District 3, St. Tammany Parish, LA (18,704)
- District 9, St. Tammany Parish, LA (17,093)
Top 10 Neighboring Place (by Population) Neighboring Place on the Map
- New Orleans city, LA (343,829)
- Metairie CDP, LA (138,481)
- Kenner city, LA (66,702)
- Marrero CDP, LA (33,141)
- Slidell city, LA (27,068)
- Terrytown CDP, LA (23,319)
- Harvey CDP, LA (20,348)
- Hammond city, LA (20,019)
- Gretna city, LA (17,736)
- River Ridge CDP, LA (13,494)
Top 10 Neighboring Unified School District (by Population) Neighboring Unified School District on the Map
- Jefferson Parish School District, LA (432,552)
- Orleans Parish School District, LA (343,829)
- St. Tammany Parish School District, LA (233,740)
- Livingston Parish School District, LA (128,026)
- Tangipahoa Parish School District, LA (121,097)
- St. Charles Parish School District, LA (52,780)
- St. John the Baptist Parish School District, LA (45,924)
- St. Bernard Parish School District, LA (35,897)
- Washington Parish School District, LA (34,936)
- Hancock County School District, MS (28,715)
Top 10 Neighboring State Legislative District Lower Chamber (by Population) Neighboring State Legislative District Lower Chamber on the Map
- State House District 77, LA (62,319)
- State House District 88, LA (62,308)
- State House District 74, LA (55,721)
- State House District 73, LA (54,461)
- State House District 89, LA (51,820)
- State House District 62, LA (51,347)
- State House District 76, LA (50,170)
- State House District 56, LA (47,201)
- State House District 90, LA (45,481)
- State House District 75, LA (44,623)
Top 10 Neighboring State Legislative District Upper Chamber (by Population) Neighboring State Legislative District Upper Chamber on the Map
- State Senate District 18, LA (156,556)
- State Senate District 13, LA (155,195)
- State Senate District 11, LA (143,310)
- State Senate District 6, LA (137,299)
- State Senate District 12, LA (136,047)
- State Senate District 19, LA (127,628)
- State Senate District 8, LA (113,097)
- State Senate District 7, LA (110,828)
- State Senate District 9, LA (108,304)
- State Senate District 10, LA (105,968)
Top 10 Neighboring Census Tract (by Population) Neighboring Census Tract on the Map
- Census Tract 403.05, St. Tammany Parish, LA (10,470)
- Census Tract 9537, Tangipahoa Parish, LA (10,368)
- Census Tract 401, Livingston Parish, LA (10,294)
- Census Tract 9546, Tangipahoa Parish, LA (10,211)
- Census Tract 9541.02, Tangipahoa Parish, LA (10,064)
- Census Tract 408.03, St. Tammany Parish, LA (9,326)
- Census Tract 9539, Tangipahoa Parish, LA (9,220)
- Census Tract 401.02, St. Tammany Parish, LA (9,083)
- Census Tract 403.03, St. Tammany Parish, LA (8,804)
- Census Tract 412.04, St. Tammany Parish, LA (8,790)
Top 10 Neighboring 5-Digit ZIP Code Tabulation Area (by Population) Neighboring 5-Digit ZIP Code Tabulation Area on the Map
- 70072, LA (56,344)
- 70065, LA (51,116)
- 70003, LA (40,150)
- 70058, LA (39,887)
- 70056, LA (39,082)
- 70001, LA (37,996)
- 70119, LA (36,228)
- 70458, LA (35,077)
- 70068, LA (34,101)
- 70118, LA (33,008)
Data
Demographic, Population, Households, and Housing Units
** Data sources from census 2010 **
Show Data on Map
Download Full List as CSV
Download Quick Sheet as CSV
| Subject | This Area | Louisiana | National |
|---|---|---|---|
| POPULATION | |||
| Total Population Map | 686,961 | 4,533,372 | 308,745,538 |
| POPULATION, HISPANIC OR LATINO ORIGIN | |||
| Not Hispanic or Latino Map | 634,649 | 4,340,812 | 258,267,944 |
| Hispanic or Latino Map | 52,312 | 192,560 | 50,477,594 |
| POPULATION, RACE | |||
| White alone Map | 533,213 | 2,836,192 | 223,553,265 |
| Black or African American alone Map | 109,533 | 1,452,396 | 38,929,319 |
| American Indian and Alaska Native alone Map | 2,582 | 30,579 | 2,932,248 |
| Asian alone Map | 12,956 | 70,132 | 14,674,252 |
| Native Hawaiian and Other Pacific Islander alone Map | 267 | 1,963 | 540,013 |
| Some Other Race alone Map | 16,208 | 69,227 | 19,107,368 |
| Two or More Races Map | 12,202 | 72,883 | 9,009,073 |
| POPULATION, SEX | |||
| Male Map | 335,182 | 2,219,292 | 151,781,326 |
| Female Map | 351,779 | 2,314,080 | 156,964,212 |
| POPULATION, AGE (18 YEARS) | |||
| 18 years and over Map | 527,745 | 3,415,357 | 234,564,071 |
| Under 18 years | 159,216 | 1,118,015 | 74,181,467 |
| POPULATION, AGE | |||
| Under 5 years | 44,032 | 314,260 | 20,201,362 |
| 5 to 9 years | 43,562 | 306,362 | 20,348,657 |
| 10 to 14 years | 44,340 | 306,836 | 20,677,194 |
| 15 to 17 years | 27,282 | 190,557 | 12,954,254 |
| 18 and 19 years | 17,342 | 136,222 | 9,086,089 |
| 20 years | 8,351 | 68,251 | 4,519,129 |
| 21 years | 8,200 | 67,763 | 4,354,294 |
| 22 to 24 years | 26,954 | 202,295 | 12,712,576 |
| 25 to 29 years | 48,166 | 332,925 | 21,101,849 |
| 30 to 34 years | 43,817 | 295,508 | 19,962,099 |
| 35 to 39 years | 42,254 | 276,479 | 20,179,642 |
| 40 to 44 years | 44,732 | 288,120 | 20,890,964 |
| 45 to 49 years | 50,923 | 325,046 | 22,708,591 |
| 50 to 54 years | 53,023 | 329,329 | 22,298,125 |
| 55 to 59 years | 48,447 | 292,567 | 19,664,805 |
| 60 and 61 years | 17,302 | 103,687 | 7,113,727 |
| 62 to 64 years | 24,040 | 139,308 | 9,704,197 |
| 65 and 66 years | 13,103 | 76,663 | 5,319,902 |
| 67 to 69 years | 16,658 | 101,702 | 7,115,361 |
| 70 to 74 years | 21,236 | 133,629 | 9,278,166 |
| 75 to 79 years | 16,808 | 102,876 | 7,317,795 |
| 80 to 84 years | 14,118 | 77,301 | 5,743,327 |
| 85 years and over | 12,271 | 65,686 | 5,493,433 |
| MEDIAN AGE BY SEX | |||
| Both sexes Map | 38.80 | 35.80 | 37.20 |
| Male Map | 37.30 | 34.50 | 35.80 |
| Female Map | 40.10 | 37.20 | 38.50 |
| HOUSEHOLDS | |||
| Total Households Map | 271,369 | 1,728,360 | 116,716,292 |
| HOUSEHOLDS, HOUSEHOLD TYPE | |||
| Family households: Map | 180,428 | 1,160,118 | 77,538,296 |
| Husband-wife family Map | 129,184 | 768,198 | 56,510,377 |
| Other family: Map | 51,244 | 391,920 | 21,027,919 |
| Male householder, no wife present Map | 14,384 | 95,416 | 5,777,570 |
| Female householder, no husband present Map | 36,860 | 296,504 | 15,250,349 |
| Nonfamily households: Map | 90,941 | 568,242 | 39,177,996 |
| Householder living alone Map | 73,912 | 464,334 | 31,204,909 |
| Householder not living alone Map | 17,029 | 103,908 | 7,973,087 |
| HOUSEHOLDS, HISPANIC OR LATINO ORIGIN OF HOUSEHOLDER | |||
| Not Hispanic or Latino householder: Map | 254,900 | 1,670,576 | 103,254,926 |
| Hispanic or Latino householder: Map | 16,469 | 57,784 | 13,461,366 |
| HOUSEHOLDS, RACE OF HOUSEHOLDER | |||
| Householder who is White alone | 218,772 | 1,145,250 | 89,754,352 |
| Householder who is Black or African American alone | 39,093 | 510,776 | 14,129,983 |
| Householder who is American Indian and Alaska Native alone | 985 | 10,680 | 939,707 |
| Householder who is Asian alone | 4,301 | 21,929 | 4,632,164 |
| Householder who is Native Hawaiian and Other Pacific Islander alone | 87 | 602 | 143,932 |
| Householder who is Some Other Race alone | 4,693 | 19,737 | 4,916,427 |
| Householder who is Two or More Races | 3,438 | 19,386 | 2,199,727 |
| HOUSEHOLDS, HOUSEHOLD TYPE BY HOUSEHOLD SIZE | |||
| Family households: Map | 180,428 | 1,160,118 | 77,538,296 |
| 2-person household Map | 76,033 | 469,118 | 31,882,616 |
| 3-person household Map | 44,089 | 288,790 | 17,765,829 |
| 4-person household Map | 35,271 | 226,131 | 15,214,075 |
| 5-person household Map | 16,111 | 109,210 | 7,411,997 |
| 6-person household Map | 5,694 | 40,973 | 3,026,278 |
| 7-or-more-person household Map | 3,230 | 25,896 | 2,237,501 |
| Nonfamily households: Map | 90,941 | 568,242 | 39,177,996 |
| 1-person household Map | 73,912 | 464,334 | 31,204,909 |
| 2-person household Map | 14,135 | 84,158 | 6,360,012 |
| 3-person household Map | 1,843 | 12,590 | 992,156 |
| 4-person household Map | 642 | 4,916 | 411,171 |
| 5-person household Map | 273 | 1,417 | 126,634 |
| 6-person household Map | 87 | 503 | 48,421 |
| 7-or-more-person household Map | 49 | 324 | 34,693 |
| HOUSING UNITS | |||
| Total Housing Units Map | 300,921 | 1,964,981 | 131,704,730 |
| HOUSING UNITS, OCCUPANCY STATUS | |||
| Occupied Map | 271,369 | 1,728,360 | 116,716,292 |
| Vacant Map | 29,552 | 236,621 | 14,988,438 |
| HOUSING UNITS, OCCUPIED, TENURE | |||
| Owned with a mortgage or a loan Map | 120,764 | 687,465 | 52,979,430 |
| Owned free and clear Map | 69,393 | 474,834 | 23,006,644 |
| Renter occupied Map | 81,212 | 566,061 | 40,730,218 |
| HOUSING UNITS, VACANT, VACANCY STATUS | |||
| For rent Map | 10,935 | 66,857 | 4,137,567 |
| Rented, not occupied Map | 459 | 3,273 | 206,825 |
| For sale only Map | 4,118 | 21,480 | 1,896,796 |
| Sold, not occupied Map | 905 | 7,294 | 421,032 |
| For seasonal, recreational, or occasional use Map | 3,320 | 42,253 | 4,649,298 |
| For migrant workers Map | 71 | 999 | 24,161 |
| Other vacant Map | 9,744 | 94,465 | 3,652,759 |
| HOUSING UNITS, OCCUPIED, AVERAGE HOUSEHOLD SIZE BY TENURE | |||
| Total: Map | 2.50 | 2.55 | 2.58 |
| Owner occupied Map | 2.58 | 2.61 | 2.65 |
| Renter occupied Map | 2.29 | 2.43 | 2.44 |
| HOUSING UNITS, OCCUPIED, TENURE BY RACE OF HOUSEHOLDER | |||
| Owner occupied: Map | 190,157 | 1,162,299 | 75,986,074 |
| Householder who is White alone Map | 165,075 | 863,763 | 63,446,275 |
| Householder who is Black or African American alone Map | 18,525 | 260,603 | 6,261,464 |
| Householder who is American Indian and Alaska Native alone Map | 610 | 7,239 | 509,588 |
| Householder who is Asian alone Map | 2,543 | 13,173 | 2,688,861 |
| Householder who is Native Hawaiian and Other Pacific Islander alone Map | 42 | 264 | 61,911 |
| Householder who is Some Other Race alone Map | 1,551 | 6,714 | 1,975,817 |
| Householder who is Two or More Races Map | 1,811 | 10,543 | 1,042,158 |
| Renter occupied: Map | 81,212 | 566,061 | 40,730,218 |
| Householder who is White alone Map | 53,697 | 281,487 | 26,308,077 |
| Householder who is Black or African American alone Map | 20,568 | 250,173 | 7,868,519 |
| Householder who is American Indian and Alaska Native alone Map | 375 | 3,441 | 430,119 |
| Householder who is Asian alone Map | 1,758 | 8,756 | 1,943,303 |
| Householder who is Native Hawaiian and Other Pacific Islander alone Map | 45 | 338 | 82,021 |
| Householder who is Some Other Race alone Map | 3,142 | 13,023 | 2,940,610 |
| Householder who is Two or More Races Map | 1,627 | 8,843 | 1,157,569 |
| HOUSING UNITS, OCCUPIED, TENURE BY HISPANIC OR LATINO ORIGIN OF HOUSEHOLDER | |||
| Owner occupied: Map | 190,157 | 1,162,299 | 75,986,074 |
| Not Hispanic or Latino householder Map | 182,284 | 1,135,625 | 69,617,625 |
| Hispanic or Latino householder Map | 7,873 | 26,674 | 6,368,449 |
| Renter occupied: Map | 81,212 | 566,061 | 40,730,218 |
| Not Hispanic or Latino householder Map | 72,616 | 534,951 | 33,637,301 |
| Hispanic or Latino householder Map | 8,596 | 31,110 | 7,092,917 |
| HOUSING UNITS, OCCUPIED, TENURE BY HOUSEHOLD SIZE | |||
| Owner occupied: Map | 190,157 | 1,162,299 | 75,986,074 |
| 1-person household Map | 42,484 | 261,382 | 16,453,569 |
| 2-person household Map | 68,134 | 407,137 | 27,618,605 |
| 3-person household Map | 33,761 | 208,649 | 12,517,563 |
| 4-person household Map | 27,475 | 165,907 | 10,998,793 |
| 5-person household Map | 12,073 | 76,068 | 5,057,765 |
| 6-person household Map | 4,065 | 27,092 | 1,965,796 |
| 7-or-more-person household Map | 2,165 | 16,064 | 1,373,983 |
| Renter occupied: Map | 81,212 | 566,061 | 40,730,218 |
| 1-person household Map | 31,428 | 202,952 | 14,751,340 |
| 2-person household Map | 22,034 | 146,139 | 10,624,023 |
| 3-person household Map | 12,171 | 92,731 | 6,240,422 |
| 4-person household Map | 8,438 | 65,140 | 4,626,453 |
| 5-person household Map | 4,311 | 34,559 | 2,480,866 |
| 6-person household Map | 1,716 | 14,384 | 1,108,903 |
| 7-or-more-person household Map | 1,114 | 10,156 | 898,211 |
Loading...