


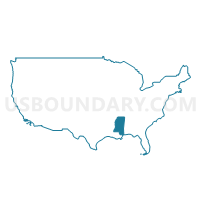
Congressional District 1, Mississippi
About
Outline

Summary
| Unique Area Identifier | 118835 |
| Name | Congressional District 1 |
| State | Mississippi |
| Area (square miles) | 11,647.49 |
| Land Area (square miles) | 11,418.08 |
| Water Area (square miles) | 229.41 |
| % of Land Area | 98.03 |
| % of Water Area | 1.97 |
| Latitude of the Internal Point | 34.24651340 |
| Longtitude of the Internal Point | -89.12113180 |
| Total Population | 788,095 |
| Total Housing Units | 338,959 |
| Total Households | 299,632 |
| Median Age | 36.6 |
Maps

Graphs
Select a template below for downloading or customizing gragh for Congressional District 1, Mississippi


Neighbors
Neighoring 111th Congressional District (by Name) Neighboring 111th Congressional District on the Map
- Congressional District 1, AR
- Congressional District 2, MS
- Congressional District 3, MS
- Congressional District 4, AL
- Congressional District 5, AL
- Congressional District 7, AL
- Congressional District 7, TN
- Congressional District 9, TN
Top 10 Neighboring County (by Population) Neighboring County on the Map
- Shelby County, TN (927,644)
- DeSoto County, MS (161,252)
- Lauderdale County, AL (92,709)
- Lee County, MS (82,910)
- Lowndes County, MS (59,779)
- Colbert County, AL (54,428)
- Crittenden County, AR (50,902)
- Oktibbeha County, MS (47,671)
- Lafayette County, MS (47,351)
- Fayette County, TN (38,413)
Top 10 Neighboring County Subdivision (by Population) Neighboring County Subdivision on the Map
- District 4, Shelby County, TN (271,890)
- District 2, Shelby County, TN (181,269)
- District 3, Shelby County, TN (178,390)
- District 1, DeSoto County, MS (44,651)
- District 5, DeSoto County, MS (38,509)
- District 2, DeSoto County, MS (30,691)
- District 3, DeSoto County, MS (27,008)
- District 4, DeSoto County, MS (20,393)
- District 2, Lee County, MS (19,233)
- District 1, Lee County, MS (17,485)
Top 10 Neighboring Place (by Population) Neighboring Place on the Map
- Memphis city, TN (646,889)
- Southaven city, MS (48,982)
- Tupelo city, MS (34,546)
- Olive Branch city, MS (33,484)
- Horn Lake city, MS (26,066)
- Columbus city, MS (23,640)
- Oxford city, MS (18,916)
- Corinth city, MS (14,573)
- Hernando city, MS (14,090)
- Grenada city, MS (13,092)
Top 10 Neighboring Unified School District (by Population) Neighboring Unified School District on the Map
- Memphis City School District, TN (646,889)
- Shelby County School District, TN (280,755)
- DeSoto County School District, MS (161,252)
- Lauderdale County School District, AL (53,390)
- Tupelo Public School District, MS (39,550)
- Fayette County School District, TN (38,413)
- Lee County School District, MS (37,543)
- Columbus Municipal School District, MS (32,903)
- Oxford School District, MS (32,421)
- Hardeman County School District, TN (27,253)
Top 10 Neighboring State Legislative District Lower Chamber (by Population) Neighboring State Legislative District Lower Chamber on the Map
- State House District 95, TN (84,049)
- State House District 94, TN (70,412)
- State House District 85, TN (67,989)
- State House District 71, TN (58,246)
- State House District 86, TN (54,462)
- State House District 6, MS (46,182)
- State House District 2, AL (45,462)
- State House District 18, AL (43,784)
- State House District 17, AL (42,595)
- State House District 61, AL (41,422)
Top 10 Neighboring State Legislative District Upper Chamber (by Population) Neighboring State Legislative District Upper Chamber on the Map
- State Senate District 26, TN (185,292)
- State Senate District 33, TN (179,193)
- State Senate District 21, AL (140,682)
- State Senate District 1, AL (135,057)
- State Senate District 6, AL (117,045)
- State Senate District 19, MS (82,994)
- State Senate District 1, MS (78,258)
- State Senate District 16, AR (68,732)
- State Senate District 9, MS (65,085)
- State Senate District 18, MS (60,602)
Top 10 Neighboring Census Tract (by Population) Neighboring Census Tract on the Map
- Census Tract 215.20, Shelby County, TN (10,210)
- Census Tract 706.30, DeSoto County, MS (10,079)
- Census Tract 705.20, DeSoto County, MS (9,492)
- Census Tract 710, DeSoto County, MS (9,005)
- Census Tract 9502, Marshall County, MS (8,400)
- Census Tract 215.10, Shelby County, TN (7,992)
- Census Tract 9507, Oktibbeha County, MS (7,820)
- Census Tract 9504, Tippah County, MS (7,813)
- Census Tract 3, Lowndes County, MS (7,756)
- Census Tract 4.01, Lowndes County, MS (7,745)
Top 10 Neighboring 5-Digit ZIP Code Tabulation Area (by Population) Neighboring 5-Digit ZIP Code Tabulation Area on the Map
- 38017, TN (48,642)
- 38109, TN (46,594)
- 38654, MS (45,956)
- 39759, MS (42,108)
- 38118, TN (41,465)
- 38116, TN (40,404)
- 38655, MS (36,699)
- 38125, TN (36,150)
- 38671, MS (35,712)
- 38801, MS (29,871)
Data
Demographic, Population, Households, and Housing Units
** Data sources from census 2010 **
Show Data on Map
Download Full List as CSV
Download Quick Sheet as CSV
| Subject | This Area | Mississippi | National |
|---|---|---|---|
| POPULATION | |||
| Total Population Map | 788,095 | 2,967,297 | 308,745,538 |
| POPULATION, HISPANIC OR LATINO ORIGIN | |||
| Not Hispanic or Latino Map | 764,815 | 2,885,816 | 258,267,944 |
| Hispanic or Latino Map | 23,280 | 81,481 | 50,477,594 |
| POPULATION, RACE | |||
| White alone Map | 543,846 | 1,754,684 | 223,553,265 |
| Black or African American alone Map | 215,873 | 1,098,385 | 38,929,319 |
| American Indian and Alaska Native alone Map | 1,650 | 15,030 | 2,932,248 |
| Asian alone Map | 4,813 | 25,742 | 14,674,252 |
| Native Hawaiian and Other Pacific Islander alone Map | 231 | 1,187 | 540,013 |
| Some Other Race alone Map | 12,742 | 38,162 | 19,107,368 |
| Two or More Races Map | 8,940 | 34,107 | 9,009,073 |
| POPULATION, SEX | |||
| Male Map | 381,426 | 1,441,240 | 151,781,326 |
| Female Map | 406,669 | 1,526,057 | 156,964,212 |
| POPULATION, AGE (18 YEARS) | |||
| 18 years and over Map | 587,761 | 2,211,742 | 234,564,071 |
| Under 18 years | 200,334 | 755,555 | 74,181,467 |
| POPULATION, AGE | |||
| Under 5 years | 54,116 | 210,956 | 20,201,362 |
| 5 to 9 years | 54,947 | 205,672 | 20,348,657 |
| 10 to 14 years | 56,619 | 208,248 | 20,677,194 |
| 15 to 17 years | 34,652 | 130,679 | 12,954,254 |
| 18 and 19 years | 25,161 | 93,940 | 9,086,089 |
| 20 years | 11,869 | 45,798 | 4,519,129 |
| 21 years | 11,358 | 43,475 | 4,354,294 |
| 22 to 24 years | 30,520 | 121,621 | 12,712,576 |
| 25 to 29 years | 49,297 | 199,082 | 21,101,849 |
| 30 to 34 years | 49,285 | 188,171 | 19,962,099 |
| 35 to 39 years | 51,845 | 187,368 | 20,179,642 |
| 40 to 44 years | 52,251 | 187,579 | 20,890,964 |
| 45 to 49 years | 56,307 | 208,369 | 22,708,591 |
| 50 to 54 years | 54,104 | 208,607 | 22,298,125 |
| 55 to 59 years | 48,091 | 186,569 | 19,664,805 |
| 60 and 61 years | 18,187 | 67,854 | 7,113,727 |
| 62 to 64 years | 25,384 | 92,902 | 9,704,197 |
| 65 and 66 years | 14,219 | 51,319 | 5,319,902 |
| 67 to 69 years | 19,157 | 69,204 | 7,115,361 |
| 70 to 74 years | 25,960 | 93,946 | 9,278,166 |
| 75 to 79 years | 18,889 | 69,876 | 7,317,795 |
| 80 to 84 years | 13,686 | 51,703 | 5,743,327 |
| 85 years and over | 12,191 | 44,359 | 5,493,433 |
| MEDIAN AGE BY SEX | |||
| Both sexes Map | 36.60 | 36.00 | 37.20 |
| Male Map | 35.20 | 34.50 | 35.80 |
| Female Map | 37.90 | 37.50 | 38.50 |
| HOUSEHOLDS | |||
| Total Households Map | 299,632 | 1,115,768 | 116,716,292 |
| HOUSEHOLDS, HOUSEHOLD TYPE | |||
| Family households: Map | 210,637 | 770,266 | 77,538,296 |
| Husband-wife family Map | 147,092 | 506,633 | 56,510,377 |
| Other family: Map | 63,545 | 263,633 | 21,027,919 |
| Male householder, no wife present Map | 14,951 | 57,661 | 5,777,570 |
| Female householder, no husband present Map | 48,594 | 205,972 | 15,250,349 |
| Nonfamily households: Map | 88,995 | 345,502 | 39,177,996 |
| Householder living alone Map | 76,213 | 293,807 | 31,204,909 |
| Householder not living alone Map | 12,782 | 51,695 | 7,973,087 |
| HOUSEHOLDS, HISPANIC OR LATINO ORIGIN OF HOUSEHOLDER | |||
| Not Hispanic or Latino householder: Map | 293,944 | 1,095,685 | 103,254,926 |
| Hispanic or Latino householder: Map | 5,688 | 20,083 | 13,461,366 |
| HOUSEHOLDS, RACE OF HOUSEHOLDER | |||
| Householder who is White alone | 215,967 | 702,166 | 89,754,352 |
| Householder who is Black or African American alone | 76,619 | 383,797 | 14,129,983 |
| Householder who is American Indian and Alaska Native alone | 607 | 4,620 | 939,707 |
| Householder who is Asian alone | 1,340 | 7,676 | 4,632,164 |
| Householder who is Native Hawaiian and Other Pacific Islander alone | 74 | 363 | 143,932 |
| Householder who is Some Other Race alone | 3,014 | 9,252 | 4,916,427 |
| Householder who is Two or More Races | 2,011 | 7,894 | 2,199,727 |
| HOUSEHOLDS, HOUSEHOLD TYPE BY HOUSEHOLD SIZE | |||
| Family households: Map | 210,637 | 770,266 | 77,538,296 |
| 2-person household Map | 87,358 | 315,384 | 31,882,616 |
| 3-person household Map | 51,523 | 188,229 | 17,765,829 |
| 4-person household Map | 41,077 | 148,008 | 15,214,075 |
| 5-person household Map | 19,383 | 72,179 | 7,411,997 |
| 6-person household Map | 7,038 | 27,612 | 3,026,278 |
| 7-or-more-person household Map | 4,258 | 18,854 | 2,237,501 |
| Nonfamily households: Map | 88,995 | 345,502 | 39,177,996 |
| 1-person household Map | 76,213 | 293,807 | 31,204,909 |
| 2-person household Map | 9,993 | 41,411 | 6,360,012 |
| 3-person household Map | 1,856 | 6,453 | 992,156 |
| 4-person household Map | 677 | 2,642 | 411,171 |
| 5-person household Map | 179 | 754 | 126,634 |
| 6-person household Map | 57 | 271 | 48,421 |
| 7-or-more-person household Map | 20 | 164 | 34,693 |
| HOUSING UNITS | |||
| Total Housing Units Map | 338,959 | 1,274,719 | 131,704,730 |
| HOUSING UNITS, OCCUPANCY STATUS | |||
| Occupied Map | 299,632 | 1,115,768 | 116,716,292 |
| Vacant Map | 39,327 | 158,951 | 14,988,438 |
| HOUSING UNITS, OCCUPIED, TENURE | |||
| Owned with a mortgage or a loan Map | 131,188 | 454,408 | 52,979,430 |
| Owned free and clear Map | 83,331 | 322,665 | 23,006,644 |
| Renter occupied Map | 85,113 | 338,695 | 40,730,218 |
| HOUSING UNITS, VACANT, VACANCY STATUS | |||
| For rent Map | 10,194 | 44,735 | 4,137,567 |
| Rented, not occupied Map | 504 | 1,920 | 206,825 |
| For sale only Map | 4,857 | 16,886 | 1,896,796 |
| Sold, not occupied Map | 1,424 | 4,915 | 421,032 |
| For seasonal, recreational, or occasional use Map | 7,624 | 28,867 | 4,649,298 |
| For migrant workers Map | 67 | 318 | 24,161 |
| Other vacant Map | 14,657 | 61,310 | 3,652,759 |
| HOUSING UNITS, OCCUPIED, AVERAGE HOUSEHOLD SIZE BY TENURE | |||
| Total: Map | 2.58 | 2.58 | 2.58 |
| Owner occupied Map | 2.60 | 2.60 | 2.65 |
| Renter occupied Map | 2.51 | 2.53 | 2.44 |
| HOUSING UNITS, OCCUPIED, TENURE BY RACE OF HOUSEHOLDER | |||
| Owner occupied: Map | 214,519 | 777,073 | 75,986,074 |
| Householder who is White alone Map | 166,475 | 544,576 | 63,446,275 |
| Householder who is Black or African American alone Map | 44,393 | 217,563 | 6,261,464 |
| Householder who is American Indian and Alaska Native alone Map | 359 | 2,977 | 509,588 |
| Householder who is Asian alone Map | 884 | 4,531 | 2,688,861 |
| Householder who is Native Hawaiian and Other Pacific Islander alone Map | 38 | 147 | 61,911 |
| Householder who is Some Other Race alone Map | 1,221 | 2,922 | 1,975,817 |
| Householder who is Two or More Races Map | 1,149 | 4,357 | 1,042,158 |
| Renter occupied: Map | 85,113 | 338,695 | 40,730,218 |
| Householder who is White alone Map | 49,492 | 157,590 | 26,308,077 |
| Householder who is Black or African American alone Map | 32,226 | 166,234 | 7,868,519 |
| Householder who is American Indian and Alaska Native alone Map | 248 | 1,643 | 430,119 |
| Householder who is Asian alone Map | 456 | 3,145 | 1,943,303 |
| Householder who is Native Hawaiian and Other Pacific Islander alone Map | 36 | 216 | 82,021 |
| Householder who is Some Other Race alone Map | 1,793 | 6,330 | 2,940,610 |
| Householder who is Two or More Races Map | 862 | 3,537 | 1,157,569 |
| HOUSING UNITS, OCCUPIED, TENURE BY HISPANIC OR LATINO ORIGIN OF HOUSEHOLDER | |||
| Owner occupied: Map | 214,519 | 777,073 | 75,986,074 |
| Not Hispanic or Latino householder Map | 211,860 | 768,762 | 69,617,625 |
| Hispanic or Latino householder Map | 2,659 | 8,311 | 6,368,449 |
| Renter occupied: Map | 85,113 | 338,695 | 40,730,218 |
| Not Hispanic or Latino householder Map | 82,084 | 326,923 | 33,637,301 |
| Hispanic or Latino householder Map | 3,029 | 11,772 | 7,092,917 |
| HOUSING UNITS, OCCUPIED, TENURE BY HOUSEHOLD SIZE | |||
| Owner occupied: Map | 214,519 | 777,073 | 75,986,074 |
| 1-person household Map | 47,460 | 179,249 | 16,453,569 |
| 2-person household Map | 76,503 | 273,683 | 27,618,605 |
| 3-person household Map | 38,596 | 136,888 | 12,517,563 |
| 4-person household Map | 30,636 | 107,309 | 10,998,793 |
| 5-person household Map | 13,722 | 49,858 | 5,057,765 |
| 6-person household Map | 4,847 | 18,207 | 1,965,796 |
| 7-or-more-person household Map | 2,755 | 11,879 | 1,373,983 |
| Renter occupied: Map | 85,113 | 338,695 | 40,730,218 |
| 1-person household Map | 28,753 | 114,558 | 14,751,340 |
| 2-person household Map | 20,848 | 83,112 | 10,624,023 |
| 3-person household Map | 14,783 | 57,794 | 6,240,422 |
| 4-person household Map | 11,118 | 43,341 | 4,626,453 |
| 5-person household Map | 5,840 | 23,075 | 2,480,866 |
| 6-person household Map | 2,248 | 9,676 | 1,108,903 |
| 7-or-more-person household Map | 1,523 | 7,139 | 898,211 |
Loading...