


Congressional District 6, Missouri
About
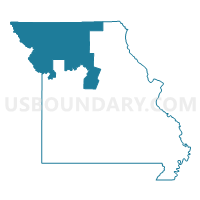
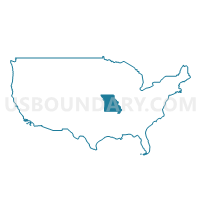
Outline

Summary
| Unique Area Identifier | 118966 |
| Name | Congressional District 6 |
| State | Missouri |
| Area (square miles) | 13,124.92 |
| Land Area (square miles) | 13,001.47 |
| Water Area (square miles) | 123.45 |
| % of Land Area | 99.06 |
| % of Water Area | 0.94 |
| Latitude of the Internal Point | 39.89908920 |
| Longtitude of the Internal Point | -93.90816160 |
| Total Population | 693,974 |
| Total Housing Units | 301,660 |
| Total Households | 270,449 |
| Median Age | 37.9 |
Maps
Graphs
Select a template below for downloading or customizing gragh for Congressional District 6, Missouri


Neighbors
Neighoring 111th Congressional District (by Name) Neighboring 111th Congressional District on the Map
- Congressional District 1, NE
- Congressional District 2, KS
- Congressional District 2, IA
- Congressional District 3, KS
- Congressional District 4, MO
- Congressional District 5, MO
- Congressional District 5, IA
- Congressional District 9, MO
Top 10 Neighboring County (by Population) Neighboring County on the Map
- Jackson County, MO (674,158)
- Clay County, MO (221,939)
- Boone County, MO (162,642)
- Wyandotte County, KS (157,505)
- Platte County, MO (89,322)
- Buchanan County, MO (89,201)
- Leavenworth County, KS (76,227)
- Pettis County, MO (42,201)
- Lafayette County, MO (33,381)
- Adair County, MO (25,607)
Top 10 Neighboring County Subdivision (by Population) Neighboring County Subdivision on the Map
- Kaw township, Jackson County, MO (170,129)
- Blue township, Jackson County, MO (160,322)
- Kansas City city, Wyandotte County, KS (145,786)
- Prairie township, Jackson County, MO (99,433)
- Sni-A-Bar township, Jackson County, MO (81,927)
- Washington township, Buchanan County, MO (78,865)
- Brooking township, Jackson County, MO (77,014)
- Gallatin township, Clay County, MO (68,393)
- Liberty township, Clay County, MO (56,978)
- Chouteau township, Clay County, MO (50,819)
Top 10 Neighboring Place (by Population) Neighboring Place on the Map
- Kansas City city, MO (459,787)
- Kansas City city, KS (145,786)
- Independence city, MO (116,830)
- Lee's Summit city, MO (91,364)
- St. Joseph city, MO (76,780)
- Blue Springs city, MO (52,575)
- Liberty city, MO (29,149)
- Gladstone city, MO (25,410)
- Grain Valley city, MO (12,854)
- Maryville city, MO (11,972)
Top 10 Neighboring Elementary School District (by Population) Neighboring Elementary School District on the Map
- Renick R-V School District, MO (1,210)
- Avenue City R-IX School District, MO (1,142)
- Blackwater R-II School District, MO (913)
- Clarksburg C-2 School District, MO (805)
- Callao C-8 School District, MO (645)
- Livingston County R-III School District, MO (622)
- Spickard R-II School District, MO (589)
- Hardeman R-X School District, MO (578)
- Miami R-I School District, MO (569)
- Missouri City 56 School District, MO (519)
Top 10 Neighboring Unified School District (by Population) Neighboring Unified School District on the Map
- Kansas City School District, MO (194,122)
- Columbia Public Schools, MO (136,836)
- North Kansas City School District, MO (123,348)
- Kansas City Unified School District 500, KS (115,219)
- Independence Public Schools, MO (94,720)
- Lee's Summit R-7 School District, MO (91,982)
- St. Joseph School District, MO (80,701)
- Blue Springs R-IV School District, MO (76,331)
- Park Hill School District, MO (62,261)
- Liberty Schools, MO (53,223)
Top 10 Neighboring State Legislative District Lower Chamber (by Population) Neighboring State Legislative District Lower Chamber on the Map
- State House District 35, MO (58,725)
- State House District 24, MO (46,896)
- State House District 38, MO (45,769)
- State House District 55, MO (44,553)
- State House District 32, MO (43,330)
- State House District 30, MO (42,652)
- State House District 56, MO (42,172)
- State House District 54, MO (41,346)
- State House District 122, MO (40,384)
- State House District 28, MO (38,291)
Top 10 Neighboring State Legislative District Upper Chamber (by Population) Neighboring State Legislative District Upper Chamber on the Map
- State Senate District 8, MO (205,505)
- State Senate District 17, MO (199,316)
- State Senate District 19, MO (188,056)
- State Senate District 6, MO (181,242)
- State Senate District 34, MO (178,523)
- State Senate District 28, MO (177,259)
- State Senate District 12, MO (169,332)
- State Senate District 11, MO (166,163)
- State Senate District 21, MO (163,305)
- State Senate District 10, MO (160,344)
Top 10 Neighboring Census Tract (by Population) Neighboring Census Tract on the Map
- Census Tract 18.05, Boone County, MO (9,020)
- Census Tract 801, DeKalb County, MO (8,900)
- Census Tract 4703, Nodaway County, MO (8,415)
- Census Tract 216, Clay County, MO (8,254)
- Census Tract 303.05, Platte County, MO (8,221)
- Census Tract 218.05, Clay County, MO (8,079)
- Census Tract 142.04, Jackson County, MO (7,993)
- Census Tract 141.05, Jackson County, MO (7,828)
- Census Tract 9819, Leavenworth County, KS (7,815)
- Census Tract 302.09, Platte County, MO (7,799)
Top 10 Neighboring 5-Digit ZIP Code Tabulation Area (by Population) Neighboring 5-Digit ZIP Code Tabulation Area on the Map
- 64118, MO (40,191)
- 64068, MO (36,280)
- 66048, KS (35,475)
- 65301, MO (34,267)
- 64055, MO (33,858)
- 64015, MO (31,217)
- 64119, MO (27,341)
- 64152, MO (26,024)
- 66104, KS (25,401)
- 64014, MO (24,797)
Data
Demographic, Population, Households, and Housing Units
** Data sources from census 2010 **
Show Data on Map
Download Full List as CSV
Download Quick Sheet as CSV
| Subject | This Area | Missouri | National |
|---|---|---|---|
| POPULATION | |||
| Total Population Map | 693,974 | 5,988,927 | 308,745,538 |
| POPULATION, HISPANIC OR LATINO ORIGIN | |||
| Not Hispanic or Latino Map | 664,721 | 5,776,457 | 258,267,944 |
| Hispanic or Latino Map | 29,253 | 212,470 | 50,477,594 |
| POPULATION, RACE | |||
| White alone Map | 626,658 | 4,958,770 | 223,553,265 |
| Black or African American alone Map | 30,031 | 693,391 | 38,929,319 |
| American Indian and Alaska Native alone Map | 3,165 | 27,376 | 2,932,248 |
| Asian alone Map | 9,174 | 98,083 | 14,674,252 |
| Native Hawaiian and Other Pacific Islander alone Map | 1,253 | 6,261 | 540,013 |
| Some Other Race alone Map | 8,746 | 80,457 | 19,107,368 |
| Two or More Races Map | 14,947 | 124,589 | 9,009,073 |
| POPULATION, SEX | |||
| Male Map | 343,552 | 2,933,477 | 151,781,326 |
| Female Map | 350,422 | 3,055,450 | 156,964,212 |
| POPULATION, AGE (18 YEARS) | |||
| 18 years and over Map | 523,441 | 4,563,491 | 234,564,071 |
| Under 18 years | 170,533 | 1,425,436 | 74,181,467 |
| POPULATION, AGE | |||
| Under 5 years | 46,504 | 390,237 | 20,201,362 |
| 5 to 9 years | 47,426 | 390,463 | 20,348,657 |
| 10 to 14 years | 47,568 | 396,925 | 20,677,194 |
| 15 to 17 years | 29,035 | 247,811 | 12,954,254 |
| 18 and 19 years | 18,990 | 175,975 | 9,086,089 |
| 20 years | 9,269 | 86,528 | 4,519,129 |
| 21 years | 8,590 | 83,511 | 4,354,294 |
| 22 to 24 years | 25,510 | 243,250 | 12,712,576 |
| 25 to 29 years | 45,099 | 403,239 | 21,101,849 |
| 30 to 34 years | 44,263 | 372,228 | 19,962,099 |
| 35 to 39 years | 45,362 | 368,070 | 20,179,642 |
| 40 to 44 years | 46,071 | 380,546 | 20,890,964 |
| 45 to 49 years | 52,338 | 444,766 | 22,708,591 |
| 50 to 54 years | 51,570 | 443,806 | 22,298,125 |
| 55 to 59 years | 44,772 | 389,985 | 19,664,805 |
| 60 and 61 years | 16,461 | 140,830 | 7,113,727 |
| 62 to 64 years | 22,136 | 192,463 | 9,704,197 |
| 65 and 66 years | 12,393 | 108,394 | 5,319,902 |
| 67 to 69 years | 16,674 | 148,659 | 7,115,361 |
| 70 to 74 years | 21,208 | 193,437 | 9,278,166 |
| 75 to 79 years | 16,580 | 155,271 | 7,317,795 |
| 80 to 84 years | 12,992 | 118,754 | 5,743,327 |
| 85 years and over | 13,163 | 113,779 | 5,493,433 |
| MEDIAN AGE BY SEX | |||
| Both sexes Map | 37.90 | 37.90 | 37.20 |
| Male Map | 36.60 | 36.50 | 35.80 |
| Female Map | 39.00 | 39.20 | 38.50 |
| HOUSEHOLDS | |||
| Total Households Map | 270,449 | 2,375,611 | 116,716,292 |
| HOUSEHOLDS, HOUSEHOLD TYPE | |||
| Family households: Map | 182,969 | 1,552,133 | 77,538,296 |
| Husband-wife family Map | 142,232 | 1,150,929 | 56,510,377 |
| Other family: Map | 40,737 | 401,204 | 21,027,919 |
| Male householder, no wife present Map | 12,429 | 109,000 | 5,777,570 |
| Female householder, no husband present Map | 28,308 | 292,204 | 15,250,349 |
| Nonfamily households: Map | 87,480 | 823,478 | 39,177,996 |
| Householder living alone Map | 71,749 | 672,276 | 31,204,909 |
| Householder not living alone Map | 15,731 | 151,202 | 7,973,087 |
| HOUSEHOLDS, HISPANIC OR LATINO ORIGIN OF HOUSEHOLDER | |||
| Not Hispanic or Latino householder: Map | 262,675 | 2,319,445 | 103,254,926 |
| Hispanic or Latino householder: Map | 7,774 | 56,166 | 13,461,366 |
| HOUSEHOLDS, RACE OF HOUSEHOLDER | |||
| Householder who is White alone | 250,845 | 2,020,416 | 89,754,352 |
| Householder who is Black or African American alone | 9,778 | 259,539 | 14,129,983 |
| Householder who is American Indian and Alaska Native alone | 1,152 | 10,427 | 939,707 |
| Householder who is Asian alone | 2,704 | 31,808 | 4,632,164 |
| Householder who is Native Hawaiian and Other Pacific Islander alone | 302 | 1,605 | 143,932 |
| Householder who is Some Other Race alone | 2,407 | 20,727 | 4,916,427 |
| Householder who is Two or More Races | 3,261 | 31,089 | 2,199,727 |
| HOUSEHOLDS, HOUSEHOLD TYPE BY HOUSEHOLD SIZE | |||
| Family households: Map | 182,969 | 1,552,133 | 77,538,296 |
| 2-person household Map | 82,424 | 699,051 | 31,882,616 |
| 3-person household Map | 40,881 | 352,533 | 17,765,829 |
| 4-person household Map | 35,131 | 289,496 | 15,214,075 |
| 5-person household Map | 15,722 | 133,129 | 7,411,997 |
| 6-person household Map | 5,673 | 49,302 | 3,026,278 |
| 7-or-more-person household Map | 3,138 | 28,622 | 2,237,501 |
| Nonfamily households: Map | 87,480 | 823,478 | 39,177,996 |
| 1-person household Map | 71,749 | 672,276 | 31,204,909 |
| 2-person household Map | 13,058 | 123,465 | 6,360,012 |
| 3-person household Map | 1,762 | 17,929 | 992,156 |
| 4-person household Map | 612 | 7,052 | 411,171 |
| 5-person household Map | 200 | 1,848 | 126,634 |
| 6-person household Map | 61 | 559 | 48,421 |
| 7-or-more-person household Map | 38 | 349 | 34,693 |
| HOUSING UNITS | |||
| Total Housing Units Map | 301,660 | 2,712,729 | 131,704,730 |
| HOUSING UNITS, OCCUPANCY STATUS | |||
| Occupied Map | 270,449 | 2,375,611 | 116,716,292 |
| Vacant Map | 31,211 | 337,118 | 14,988,438 |
| HOUSING UNITS, OCCUPIED, TENURE | |||
| Owned with a mortgage or a loan Map | 132,237 | 1,118,792 | 52,979,430 |
| Owned free and clear Map | 59,570 | 514,818 | 23,006,644 |
| Renter occupied Map | 78,642 | 742,001 | 40,730,218 |
| HOUSING UNITS, VACANT, VACANCY STATUS | |||
| For rent Map | 9,139 | 92,946 | 4,137,567 |
| Rented, not occupied Map | 431 | 4,290 | 206,825 |
| For sale only Map | 4,525 | 44,200 | 1,896,796 |
| Sold, not occupied Map | 1,154 | 11,098 | 421,032 |
| For seasonal, recreational, or occasional use Map | 4,645 | 80,374 | 4,649,298 |
| For migrant workers Map | 6 | 193 | 24,161 |
| Other vacant Map | 11,311 | 104,017 | 3,652,759 |
| HOUSING UNITS, OCCUPIED, AVERAGE HOUSEHOLD SIZE BY TENURE | |||
| Total: Map | 2.49 | 2.45 | 2.58 |
| Owner occupied Map | 2.58 | 2.54 | 2.65 |
| Renter occupied Map | 2.25 | 2.25 | 2.44 |
| HOUSING UNITS, OCCUPIED, TENURE BY RACE OF HOUSEHOLDER | |||
| Owner occupied: Map | 191,807 | 1,633,610 | 75,986,074 |
| Householder who is White alone Map | 183,024 | 1,474,738 | 63,446,275 |
| Householder who is Black or African American alone Map | 3,568 | 110,128 | 6,261,464 |
| Householder who is American Indian and Alaska Native alone Map | 665 | 6,019 | 509,588 |
| Householder who is Asian alone Map | 1,722 | 17,427 | 2,688,861 |
| Householder who is Native Hawaiian and Other Pacific Islander alone Map | 88 | 600 | 61,911 |
| Householder who is Some Other Race alone Map | 1,056 | 8,794 | 1,975,817 |
| Householder who is Two or More Races Map | 1,684 | 15,904 | 1,042,158 |
| Renter occupied: Map | 78,642 | 742,001 | 40,730,218 |
| Householder who is White alone Map | 67,821 | 545,678 | 26,308,077 |
| Householder who is Black or African American alone Map | 6,210 | 149,411 | 7,868,519 |
| Householder who is American Indian and Alaska Native alone Map | 487 | 4,408 | 430,119 |
| Householder who is Asian alone Map | 982 | 14,381 | 1,943,303 |
| Householder who is Native Hawaiian and Other Pacific Islander alone Map | 214 | 1,005 | 82,021 |
| Householder who is Some Other Race alone Map | 1,351 | 11,933 | 2,940,610 |
| Householder who is Two or More Races Map | 1,577 | 15,185 | 1,157,569 |
| HOUSING UNITS, OCCUPIED, TENURE BY HISPANIC OR LATINO ORIGIN OF HOUSEHOLDER | |||
| Owner occupied: Map | 191,807 | 1,633,610 | 75,986,074 |
| Not Hispanic or Latino householder Map | 187,663 | 1,605,838 | 69,617,625 |
| Hispanic or Latino householder Map | 4,144 | 27,772 | 6,368,449 |
| Renter occupied: Map | 78,642 | 742,001 | 40,730,218 |
| Not Hispanic or Latino householder Map | 75,012 | 713,607 | 33,637,301 |
| Hispanic or Latino householder Map | 3,630 | 28,394 | 7,092,917 |
| HOUSING UNITS, OCCUPIED, TENURE BY HOUSEHOLD SIZE | |||
| Owner occupied: Map | 191,807 | 1,633,610 | 75,986,074 |
| 1-person household Map | 39,898 | 369,640 | 16,453,569 |
| 2-person household Map | 74,946 | 629,004 | 27,618,605 |
| 3-person household Map | 31,108 | 262,364 | 12,517,563 |
| 4-person household Map | 27,625 | 221,292 | 10,998,793 |
| 5-person household Map | 11,861 | 97,390 | 5,057,765 |
| 6-person household Map | 4,109 | 34,420 | 1,965,796 |
| 7-or-more-person household Map | 2,260 | 19,500 | 1,373,983 |
| Renter occupied: Map | 78,642 | 742,001 | 40,730,218 |
| 1-person household Map | 31,851 | 302,636 | 14,751,340 |
| 2-person household Map | 20,536 | 193,512 | 10,624,023 |
| 3-person household Map | 11,535 | 108,098 | 6,240,422 |
| 4-person household Map | 8,118 | 75,256 | 4,626,453 |
| 5-person household Map | 4,061 | 37,587 | 2,480,866 |
| 6-person household Map | 1,625 | 15,441 | 1,108,903 |
| 7-or-more-person household Map | 916 | 9,471 | 898,211 |
Loading...