


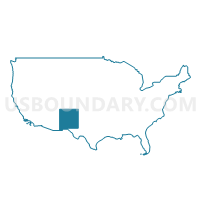
Congressional District 2, New Mexico
About
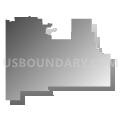
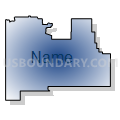
Outline

Summary
| Unique Area Identifier | 118715 |
| Name | Congressional District 2 |
| State | New Mexico |
| Area (square miles) | 69,598.56 |
| Land Area (square miles) | 69,443.92 |
| Water Area (square miles) | 154.64 |
| % of Land Area | 99.78 |
| % of Water Area | 0.22 |
| Latitude of the Internal Point | 33.36741850 |
| Longtitude of the Internal Point | -106.37529160 |
| Total Population | 663,956 |
| Total Housing Units | 289,845 |
| Total Households | 246,715 |
| Median Age | 36.1 |
Maps

Graphs
Select a template below for downloading or customizing gragh for Congressional District 2, New Mexico


Neighbors
Neighoring 111th Congressional District (by Name) Neighboring 111th Congressional District on the Map
- Congressional District 1, NM
- Congressional District 1, AZ
- Congressional District 11, TX
- Congressional District 16, TX
- Congressional District 19, TX
- Congressional District 23, TX
- Congressional District 3, NM
- Congressional District 8, AZ
Top 10 Neighboring County (by Population) Neighboring County on the Map
- El Paso County, TX (800,647)
- Bernalillo County, NM (662,564)
- Doña Ana County, NM (209,233)
- Sandoval County, NM (131,561)
- Cochise County, AZ (131,346)
- Valencia County, NM (76,569)
- Apache County, AZ (71,518)
- McKinley County, NM (71,492)
- Chaves County, NM (65,645)
- Lea County, NM (64,727)
Top 10 Neighboring County Subdivision (by Population) Neighboring County Subdivision on the Map
- Albuquerque CCD, Bernalillo County, NM (633,223)
- El Paso CCD, El Paso County, TX (550,597)
- El Paso East CCD, El Paso County, TX (160,404)
- Las Cruces CCD, Doña Ana County, NM (103,492)
- El Paso Northwest CCD, El Paso County, TX (78,624)
- Los Lunas CCD, Valencia County, NM (55,761)
- Roswell CCD, Chaves County, NM (48,143)
- Hobbs CCD, Lea County, NM (43,305)
- Alamogordo CCD, Otero County, NM (40,933)
- Doña Ana-Hill CCD, Doña Ana County, NM (36,217)
Top 10 Neighboring Place (by Population) Neighboring Place on the Map
- El Paso city, TX (649,121)
- Albuquerque city, NM (545,852)
- Las Cruces city, NM (97,618)
- Roswell city, NM (48,366)
- South Valley CDP, NM (40,976)
- Hobbs city, NM (34,122)
- Alamogordo city, NM (30,403)
- Carlsbad city, NM (26,138)
- Deming city, NM (14,855)
- Los Lunas village, NM (14,835)
Top 10 Neighboring Elementary School District (by Population) Neighboring Elementary School District on the Map
- Alpine Elementary District, AZ (463)
- Apache Elementary District, AZ (166)
- Blue Elementary District, AZ (37)
Top 10 Neighboring Unified School District (by Population) Neighboring Unified School District on the Map
- Albuquerque Public Schools, NM (667,445)
- El Paso Independent School District, TX (327,212)
- Ysleta Independent School District, TX (192,840)
- Socorro Independent School District, TX (179,910)
- Las Cruces Public Schools, NM (149,482)
- Gallup-Mckinley County Schools, NM (63,611)
- Gadsden Independent Schools, NM (62,675)
- Roswell Independent Schools, NM (58,520)
- Los Lunas Public Schools, NM (48,173)
- Alamogordo Public Schools, NM (43,326)
Top 10 Neighboring State Legislative District Lower Chamber (by Population) Neighboring State Legislative District Lower Chamber on the Map
- State House District 75, TX (219,408)
- State House District 25, AZ (208,220)
- State House District 5, AZ (192,258)
- State House District 2, AZ (177,904)
- State House District 83, TX (173,230)
- State House District 78, TX (168,785)
- State House District 81, TX (159,026)
- State House District 79, TX (147,172)
- State House District 74, TX (143,566)
- State House District 77, TX (132,567)
Top 10 Neighboring State Legislative District Upper Chamber (by Population) Neighboring State Legislative District Upper Chamber on the Map
- State Senate District 19, TX (766,044)
- State Senate District 29, TX (758,901)
- State Senate District 31, TX (727,115)
- State Senate District 25, AZ (208,220)
- State Senate District 5, AZ (192,258)
- State Senate District 2, AZ (177,904)
- State Senate District 23, NM (84,821)
- State Senate District 11, NM (77,027)
- State Senate District 37, NM (66,562)
- State Senate District 22, NM (60,988)
Top 10 Neighboring Census Tract (by Population) Neighboring Census Tract on the Map
- Census Tract 12.01, Doña Ana County, NM (14,991)
- Census Tract 9.02, Otero County, NM (9,941)
- Census Tract 13.06, Doña Ana County, NM (9,787)
- Census Tract 9406, Bernalillo County, NM (9,385)
- Census Tract 9502, Gaines County, TX (8,643)
- Census Tract 13.04, Doña Ana County, NM (7,724)
- Census Tract 102.19, El Paso County, TX (7,642)
- Census Tract 13.02, El Paso County, TX (7,344)
- Census Tract 13.03, Doña Ana County, NM (7,259)
- Census Tract 18.04, Doña Ana County, NM (6,965)
Top 10 Neighboring 5-Digit ZIP Code Tabulation Area (by Population) Neighboring 5-Digit ZIP Code Tabulation Area on the Map
- 87121, NM (76,721)
- 87105, NM (57,680)
- 79938, TX (53,520)
- 87031, NM (44,075)
- 88001, NM (37,484)
- 88240, NM (37,149)
- 88310, NM (35,776)
- 88220, NM (33,725)
- 88203, NM (31,561)
- 88011, NM (27,698)
Data
Demographic, Population, Households, and Housing Units
** Data sources from census 2010 **
Show Data on Map
Download Full List as CSV
Download Quick Sheet as CSV
| Subject | This Area | New Mexico | National |
|---|---|---|---|
| POPULATION | |||
| Total Population Map | 663,956 | 2,059,179 | 308,745,538 |
| POPULATION, HISPANIC OR LATINO ORIGIN | |||
| Not Hispanic or Latino Map | 320,100 | 1,105,776 | 258,267,944 |
| Hispanic or Latino Map | 343,856 | 953,403 | 50,477,594 |
| POPULATION, RACE | |||
| White alone Map | 483,834 | 1,407,876 | 223,553,265 |
| Black or African American alone Map | 12,609 | 42,550 | 38,929,319 |
| American Indian and Alaska Native alone Map | 37,098 | 193,222 | 2,932,248 |
| Asian alone Map | 5,192 | 28,208 | 14,674,252 |
| Native Hawaiian and Other Pacific Islander alone Map | 572 | 1,810 | 540,013 |
| Some Other Race alone Map | 104,013 | 308,503 | 19,107,368 |
| Two or More Races Map | 20,638 | 77,010 | 9,009,073 |
| POPULATION, SEX | |||
| Male Map | 331,058 | 1,017,421 | 151,781,326 |
| Female Map | 332,898 | 1,041,758 | 156,964,212 |
| POPULATION, AGE (18 YEARS) | |||
| 18 years and over Map | 492,218 | 1,540,507 | 234,564,071 |
| Under 18 years | 171,738 | 518,672 | 74,181,467 |
| POPULATION, AGE | |||
| Under 5 years | 48,385 | 144,981 | 20,201,362 |
| 5 to 9 years | 46,902 | 143,308 | 20,348,657 |
| 10 to 14 years | 46,660 | 141,691 | 20,677,194 |
| 15 to 17 years | 29,791 | 88,692 | 12,954,254 |
| 18 and 19 years | 21,597 | 61,169 | 9,086,089 |
| 20 years | 10,361 | 29,935 | 4,519,129 |
| 21 years | 9,666 | 28,237 | 4,354,294 |
| 22 to 24 years | 27,912 | 84,198 | 12,712,576 |
| 25 to 29 years | 43,889 | 139,678 | 21,101,849 |
| 30 to 34 years | 38,634 | 127,567 | 19,962,099 |
| 35 to 39 years | 37,005 | 123,303 | 20,179,642 |
| 40 to 44 years | 37,991 | 125,220 | 20,890,964 |
| 45 to 49 years | 44,468 | 144,839 | 22,708,591 |
| 50 to 54 years | 45,520 | 147,170 | 22,298,125 |
| 55 to 59 years | 42,242 | 136,799 | 19,664,805 |
| 60 and 61 years | 15,867 | 51,238 | 7,113,727 |
| 62 to 64 years | 21,902 | 68,899 | 9,704,197 |
| 65 and 66 years | 12,617 | 37,921 | 5,319,902 |
| 67 to 69 years | 17,053 | 49,969 | 7,115,361 |
| 70 to 74 years | 23,670 | 65,904 | 9,278,166 |
| 75 to 79 years | 18,273 | 50,230 | 7,317,795 |
| 80 to 84 years | 13,105 | 36,238 | 5,743,327 |
| 85 years and over | 10,446 | 31,993 | 5,493,433 |
| MEDIAN AGE BY SEX | |||
| Both sexes Map | 36.10 | 36.70 | 37.20 |
| Male Map | 34.80 | 35.30 | 35.80 |
| Female Map | 37.40 | 38.00 | 38.50 |
| HOUSEHOLDS | |||
| Total Households Map | 246,715 | 791,395 | 116,716,292 |
| HOUSEHOLDS, HOUSEHOLD TYPE | |||
| Family households: Map | 168,901 | 518,698 | 77,538,296 |
| Husband-wife family Map | 118,260 | 358,354 | 56,510,377 |
| Other family: Map | 50,641 | 160,344 | 21,027,919 |
| Male householder, no wife present Map | 14,991 | 49,408 | 5,777,570 |
| Female householder, no husband present Map | 35,650 | 110,936 | 15,250,349 |
| Nonfamily households: Map | 77,814 | 272,697 | 39,177,996 |
| Householder living alone Map | 63,939 | 221,347 | 31,204,909 |
| Householder not living alone Map | 13,875 | 51,350 | 7,973,087 |
| HOUSEHOLDS, HISPANIC OR LATINO ORIGIN OF HOUSEHOLDER | |||
| Not Hispanic or Latino householder: Map | 139,170 | 477,947 | 103,254,926 |
| Hispanic or Latino householder: Map | 107,545 | 313,448 | 13,461,366 |
| HOUSEHOLDS, RACE OF HOUSEHOLDER | |||
| Householder who is White alone | 190,700 | 583,668 | 89,754,352 |
| Householder who is Black or African American alone | 4,504 | 16,087 | 14,129,983 |
| Householder who is American Indian and Alaska Native alone | 10,949 | 56,494 | 939,707 |
| Householder who is Asian alone | 1,718 | 9,573 | 4,632,164 |
| Householder who is Native Hawaiian and Other Pacific Islander alone | 165 | 597 | 143,932 |
| Householder who is Some Other Race alone | 32,609 | 102,631 | 4,916,427 |
| Householder who is Two or More Races | 6,070 | 22,345 | 2,199,727 |
| HOUSEHOLDS, HOUSEHOLD TYPE BY HOUSEHOLD SIZE | |||
| Family households: Map | 168,901 | 518,698 | 77,538,296 |
| 2-person household Map | 70,592 | 216,503 | 31,882,616 |
| 3-person household Map | 37,128 | 116,153 | 17,765,829 |
| 4-person household Map | 30,454 | 96,379 | 15,214,075 |
| 5-person household Map | 17,922 | 52,499 | 7,411,997 |
| 6-person household Map | 7,564 | 21,714 | 3,026,278 |
| 7-or-more-person household Map | 5,241 | 15,450 | 2,237,501 |
| Nonfamily households: Map | 77,814 | 272,697 | 39,177,996 |
| 1-person household Map | 63,939 | 221,347 | 31,204,909 |
| 2-person household Map | 11,606 | 43,741 | 6,360,012 |
| 3-person household Map | 1,522 | 5,199 | 992,156 |
| 4-person household Map | 532 | 1,662 | 411,171 |
| 5-person household Map | 147 | 498 | 126,634 |
| 6-person household Map | 38 | 131 | 48,421 |
| 7-or-more-person household Map | 30 | 119 | 34,693 |
| HOUSING UNITS | |||
| Total Housing Units Map | 289,845 | 901,388 | 131,704,730 |
| HOUSING UNITS, OCCUPANCY STATUS | |||
| Occupied Map | 246,715 | 791,395 | 116,716,292 |
| Vacant Map | 43,130 | 109,993 | 14,988,438 |
| HOUSING UNITS, OCCUPIED, TENURE | |||
| Owned with a mortgage or a loan Map | 93,598 | 337,570 | 52,979,430 |
| Owned free and clear Map | 77,840 | 204,552 | 23,006,644 |
| Renter occupied Map | 75,277 | 249,273 | 40,730,218 |
| HOUSING UNITS, VACANT, VACANCY STATUS | |||
| For rent Map | 7,507 | 22,150 | 4,137,567 |
| Rented, not occupied Map | 423 | 1,303 | 206,825 |
| For sale only Map | 3,620 | 11,050 | 1,896,796 |
| Sold, not occupied Map | 791 | 2,143 | 421,032 |
| For seasonal, recreational, or occasional use Map | 15,576 | 36,612 | 4,649,298 |
| For migrant workers Map | 122 | 229 | 24,161 |
| Other vacant Map | 15,091 | 36,506 | 3,652,759 |
| HOUSING UNITS, OCCUPIED, AVERAGE HOUSEHOLD SIZE BY TENURE | |||
| Total: Map | 2.62 | 2.55 | 2.58 |
| Owner occupied Map | 2.65 | 2.60 | 2.65 |
| Renter occupied Map | 2.55 | 2.43 | 2.44 |
| HOUSING UNITS, OCCUPIED, TENURE BY RACE OF HOUSEHOLDER | |||
| Owner occupied: Map | 171,438 | 542,122 | 75,986,074 |
| Householder who is White alone Map | 135,525 | 414,357 | 63,446,275 |
| Householder who is Black or African American alone Map | 2,157 | 7,303 | 6,261,464 |
| Householder who is American Indian and Alaska Native alone Map | 7,934 | 36,654 | 509,588 |
| Householder who is Asian alone Map | 856 | 5,668 | 2,688,861 |
| Householder who is Native Hawaiian and Other Pacific Islander alone Map | 83 | 307 | 61,911 |
| Householder who is Some Other Race alone Map | 21,192 | 64,703 | 1,975,817 |
| Householder who is Two or More Races Map | 3,691 | 13,130 | 1,042,158 |
| Renter occupied: Map | 75,277 | 249,273 | 40,730,218 |
| Householder who is White alone Map | 55,175 | 169,311 | 26,308,077 |
| Householder who is Black or African American alone Map | 2,347 | 8,784 | 7,868,519 |
| Householder who is American Indian and Alaska Native alone Map | 3,015 | 19,840 | 430,119 |
| Householder who is Asian alone Map | 862 | 3,905 | 1,943,303 |
| Householder who is Native Hawaiian and Other Pacific Islander alone Map | 82 | 290 | 82,021 |
| Householder who is Some Other Race alone Map | 11,417 | 37,928 | 2,940,610 |
| Householder who is Two or More Races Map | 2,379 | 9,215 | 1,157,569 |
| HOUSING UNITS, OCCUPIED, TENURE BY HISPANIC OR LATINO ORIGIN OF HOUSEHOLDER | |||
| Owner occupied: Map | 171,438 | 542,122 | 75,986,074 |
| Not Hispanic or Latino householder Map | 99,852 | 334,598 | 69,617,625 |
| Hispanic or Latino householder Map | 71,586 | 207,524 | 6,368,449 |
| Renter occupied: Map | 75,277 | 249,273 | 40,730,218 |
| Not Hispanic or Latino householder Map | 39,318 | 143,349 | 33,637,301 |
| Hispanic or Latino householder Map | 35,959 | 105,924 | 7,092,917 |
| HOUSING UNITS, OCCUPIED, TENURE BY HOUSEHOLD SIZE | |||
| Owner occupied: Map | 171,438 | 542,122 | 75,986,074 |
| 1-person household Map | 38,864 | 129,376 | 16,453,569 |
| 2-person household Map | 63,535 | 197,623 | 27,618,605 |
| 3-person household Map | 26,139 | 83,241 | 12,517,563 |
| 4-person household Map | 21,323 | 69,174 | 10,998,793 |
| 5-person household Map | 12,495 | 36,671 | 5,057,765 |
| 6-person household Map | 5,297 | 15,045 | 1,965,796 |
| 7-or-more-person household Map | 3,785 | 10,992 | 1,373,983 |
| Renter occupied: Map | 75,277 | 249,273 | 40,730,218 |
| 1-person household Map | 25,075 | 91,971 | 14,751,340 |
| 2-person household Map | 18,663 | 62,621 | 10,624,023 |
| 3-person household Map | 12,511 | 38,111 | 6,240,422 |
| 4-person household Map | 9,663 | 28,867 | 4,626,453 |
| 5-person household Map | 5,574 | 16,326 | 2,480,866 |
| 6-person household Map | 2,305 | 6,800 | 1,108,903 |
| 7-or-more-person household Map | 1,486 | 4,577 | 898,211 |
Loading...