


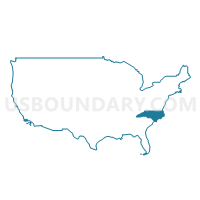
Congressional District 2, North Carolina
About
Outline

Summary
| Unique Area Identifier | 119104 |
| Name | Congressional District 2 |
| State | North Carolina |
| Area (square miles) | 3,979.01 |
| Land Area (square miles) | 3,951.74 |
| Water Area (square miles) | 27.27 |
| % of Land Area | 99.31 |
| % of Water Area | 0.69 |
| Latitude of the Internal Point | 35.55105660 |
| Longtitude of the Internal Point | -78.58571470 |
| Total Population | 741,576 |
| Total Housing Units | 302,854 |
| Total Households | 271,902 |
| Median Age | 34 |
Maps

Graphs
Select a template below for downloading or customizing gragh for Congressional District 2, North Carolina


Neighbors
Neighoring 111th Congressional District (by Name) Neighboring 111th Congressional District on the Map
- Congressional District 1, NC
- Congressional District 13, NC
- Congressional District 3, NC
- Congressional District 4, NC
- Congressional District 6, NC
- Congressional District 7, NC
- Congressional District 8, NC
Top 10 Neighboring County (by Population) Neighboring County on the Map
- Wake County, NC (900,993)
- Cumberland County, NC (319,431)
- Johnston County, NC (168,878)
- Alamance County, NC (151,131)
- Randolph County, NC (141,752)
- Wayne County, NC (122,623)
- Harnett County, NC (114,678)
- Nash County, NC (95,840)
- Moore County, NC (88,247)
- Wilson County, NC (81,234)
Top 10 Neighboring County Subdivision (by Population) Neighboring County Subdivision on the Map
- Raleigh township, Wake County, NC (117,838)
- Seventy-First township, Cumberland County, NC (93,772)
- Cross Creek township, Cumberland County, NC (66,163)
- St. Matthews township, Wake County, NC (65,731)
- Wake Forest township, Wake County, NC (65,491)
- St. Marys township, Wake County, NC (58,484)
- Swift Creek township, Wake County, NC (50,225)
- Middle Creek township, Wake County, NC (44,136)
- Holly Springs township, Wake County, NC (33,071)
- Clayton township, Johnston County, NC (30,712)
Top 10 Neighboring Place (by Population) Neighboring Place on the Map
- Raleigh city, NC (403,892)
- Fayetteville city, NC (200,564)
- Cary town, NC (135,234)
- Rocky Mount city, NC (57,477)
- Wake Forest town, NC (30,117)
- Sanford city, NC (28,094)
- Garner town, NC (25,745)
- Clayton town, NC (16,116)
- Henderson city, NC (15,368)
- Spring Lake town, NC (11,964)
Top 10 Neighboring Unified School District (by Population) Neighboring Unified School District on the Map
- Wake County Schools, NC (900,993)
- Cumberland County Schools, NC (297,793)
- Johnston County Schools, NC (168,878)
- Alamance-Burlington Schools, NC (151,131)
- Wayne County Public Schools, NC (122,623)
- Harnett County Schools, NC (114,678)
- Randolph County Schools, NC (113,222)
- Nash-Rocky Mount Schools, NC (106,786)
- Moore County Schools, NC (88,247)
- Wilson County Schools, NC (81,234)
Top 10 Neighboring State Legislative District Lower Chamber (by Population) Neighboring State Legislative District Lower Chamber on the Map
- State House District 37, NC (129,250)
- State House District 40, NC (125,208)
- State House District 39, NC (104,910)
- State House District 26, NC (95,937)
- State House District 33, NC (94,755)
- State House District 28, NC (93,901)
- State House District 16, NC (93,684)
- State House District 51, NC (92,118)
- State House District 38, NC (84,275)
- State House District 22, NC (83,941)
Top 10 Neighboring State Legislative District Upper Chamber (by Population) Neighboring State Legislative District Upper Chamber on the Map
- State Senate District 17, NC (246,945)
- State Senate District 14, NC (232,514)
- State Senate District 16, NC (220,672)
- State Senate District 8, NC (217,746)
- State Senate District 12, NC (210,500)
- State Senate District 18, NC (207,334)
- State Senate District 22, NC (202,925)
- State Senate District 15, NC (200,862)
- State Senate District 19, NC (190,504)
- State Senate District 7, NC (186,929)
Top 10 Neighboring Census Tract (by Population) Neighboring Census Tract on the Map
- Census Tract 402.03, Johnston County, NC (14,249)
- Census Tract 528.06, Wake County, NC (13,750)
- Census Tract 411.03, Johnston County, NC (12,699)
- Census Tract 32.01, Cumberland County, NC (11,431)
- Census Tract 9701.02, Hoke County, NC (11,350)
- Census Tract 409.01, Johnston County, NC (10,844)
- Census Tract 411.02, Johnston County, NC (9,637)
- Census Tract 528.03, Wake County, NC (9,464)
- Census Tract 528.08, Wake County, NC (9,146)
- Census Tract 14, Wilson County, NC (8,885)
Top 10 Neighboring 5-Digit ZIP Code Tabulation Area (by Population) Neighboring 5-Digit ZIP Code Tabulation Area on the Map
- 27610, NC (65,648)
- 28314, NC (54,520)
- 27587, NC (53,078)
- 27603, NC (47,033)
- 27606, NC (43,210)
- 27529, NC (42,128)
- 27530, NC (40,117)
- 27526, NC (38,894)
- 28376, NC (37,991)
- 27330, NC (37,947)
Data
Demographic, Population, Households, and Housing Units
** Data sources from census 2010 **
Show Data on Map
Download Full List as CSV
Download Quick Sheet as CSV
| Subject | This Area | North Carolina | National |
|---|---|---|---|
| POPULATION | |||
| Total Population Map | 741,576 | 9,535,483 | 308,745,538 |
| POPULATION, HISPANIC OR LATINO ORIGIN | |||
| Not Hispanic or Latino Map | 649,368 | 8,735,363 | 258,267,944 |
| Hispanic or Latino Map | 92,208 | 800,120 | 50,477,594 |
| POPULATION, RACE | |||
| White alone Map | 446,631 | 6,528,950 | 223,553,265 |
| Black or African American alone Map | 210,845 | 2,048,628 | 38,929,319 |
| American Indian and Alaska Native alone Map | 5,834 | 122,110 | 2,932,248 |
| Asian alone Map | 8,408 | 208,962 | 14,674,252 |
| Native Hawaiian and Other Pacific Islander alone Map | 766 | 6,604 | 540,013 |
| Some Other Race alone Map | 49,473 | 414,030 | 19,107,368 |
| Two or More Races Map | 19,619 | 206,199 | 9,009,073 |
| POPULATION, SEX | |||
| Male Map | 365,010 | 4,645,492 | 151,781,326 |
| Female Map | 376,566 | 4,889,991 | 156,964,212 |
| POPULATION, AGE (18 YEARS) | |||
| 18 years and over Map | 550,661 | 7,253,848 | 234,564,071 |
| Under 18 years | 190,915 | 2,281,635 | 74,181,467 |
| POPULATION, AGE | |||
| Under 5 years | 55,866 | 632,040 | 20,201,362 |
| 5 to 9 years | 53,554 | 635,945 | 20,348,657 |
| 10 to 14 years | 51,484 | 631,104 | 20,677,194 |
| 15 to 17 years | 30,011 | 382,546 | 12,954,254 |
| 18 and 19 years | 27,081 | 277,045 | 9,086,089 |
| 20 years | 14,011 | 141,076 | 4,519,129 |
| 21 years | 12,686 | 136,169 | 4,354,294 |
| 22 to 24 years | 33,244 | 384,328 | 12,712,576 |
| 25 to 29 years | 51,889 | 627,036 | 21,101,849 |
| 30 to 34 years | 50,714 | 619,557 | 19,962,099 |
| 35 to 39 years | 52,314 | 659,843 | 20,179,642 |
| 40 to 44 years | 51,108 | 667,308 | 20,890,964 |
| 45 to 49 years | 51,251 | 698,753 | 22,708,591 |
| 50 to 54 years | 47,660 | 669,893 | 22,298,125 |
| 55 to 59 years | 42,117 | 600,722 | 19,664,805 |
| 60 and 61 years | 15,409 | 222,924 | 7,113,727 |
| 62 to 64 years | 21,115 | 315,115 | 9,704,197 |
| 65 and 66 years | 11,542 | 172,919 | 5,319,902 |
| 67 to 69 years | 15,160 | 230,105 | 7,115,361 |
| 70 to 74 years | 19,545 | 294,543 | 9,278,166 |
| 75 to 79 years | 14,560 | 223,655 | 7,317,795 |
| 80 to 84 years | 10,454 | 165,396 | 5,743,327 |
| 85 years and over | 8,801 | 147,461 | 5,493,433 |
| MEDIAN AGE BY SEX | |||
| Both sexes Map | 34.00 | 37.40 | 37.20 |
| Male Map | 32.50 | 36.00 | 35.80 |
| Female Map | 35.50 | 38.70 | 38.50 |
| HOUSEHOLDS | |||
| Total Households Map | 271,902 | 3,745,155 | 116,716,292 |
| HOUSEHOLDS, HOUSEHOLD TYPE | |||
| Family households: Map | 187,798 | 2,499,174 | 77,538,296 |
| Husband-wife family Map | 131,286 | 1,812,029 | 56,510,377 |
| Other family: Map | 56,512 | 687,145 | 21,027,919 |
| Male householder, no wife present Map | 14,048 | 173,010 | 5,777,570 |
| Female householder, no husband present Map | 42,464 | 514,135 | 15,250,349 |
| Nonfamily households: Map | 84,104 | 1,245,981 | 39,177,996 |
| Householder living alone Map | 68,033 | 1,011,348 | 31,204,909 |
| Householder not living alone Map | 16,071 | 234,633 | 7,973,087 |
| HOUSEHOLDS, HISPANIC OR LATINO ORIGIN OF HOUSEHOLDER | |||
| Not Hispanic or Latino householder: Map | 249,855 | 3,543,727 | 103,254,926 |
| Hispanic or Latino householder: Map | 22,047 | 201,428 | 13,461,366 |
| HOUSEHOLDS, RACE OF HOUSEHOLDER | |||
| Householder who is White alone | 173,398 | 2,704,474 | 89,754,352 |
| Householder who is Black or African American alone | 77,884 | 782,121 | 14,129,983 |
| Householder who is American Indian and Alaska Native alone | 1,921 | 42,897 | 939,707 |
| Householder who is Asian alone | 2,577 | 64,158 | 4,632,164 |
| Householder who is Native Hawaiian and Other Pacific Islander alone | 252 | 2,003 | 143,932 |
| Householder who is Some Other Race alone | 11,767 | 102,073 | 4,916,427 |
| Householder who is Two or More Races | 4,103 | 47,429 | 2,199,727 |
| HOUSEHOLDS, HOUSEHOLD TYPE BY HOUSEHOLD SIZE | |||
| Family households: Map | 187,798 | 2,499,174 | 77,538,296 |
| 2-person household Map | 75,526 | 1,099,222 | 31,882,616 |
| 3-person household Map | 46,148 | 597,995 | 17,765,829 |
| 4-person household Map | 37,020 | 475,037 | 15,214,075 |
| 5-person household Map | 17,632 | 206,469 | 7,411,997 |
| 6-person household Map | 7,080 | 75,600 | 3,026,278 |
| 7-or-more-person household Map | 4,392 | 44,851 | 2,237,501 |
| Nonfamily households: Map | 84,104 | 1,245,981 | 39,177,996 |
| 1-person household Map | 68,033 | 1,011,348 | 31,204,909 |
| 2-person household Map | 12,222 | 188,712 | 6,360,012 |
| 3-person household Map | 2,332 | 29,440 | 992,156 |
| 4-person household Map | 1,172 | 11,932 | 411,171 |
| 5-person household Map | 242 | 2,848 | 126,634 |
| 6-person household Map | 60 | 1,042 | 48,421 |
| 7-or-more-person household Map | 43 | 659 | 34,693 |
| HOUSING UNITS | |||
| Total Housing Units Map | 302,854 | 4,327,528 | 131,704,730 |
| HOUSING UNITS, OCCUPANCY STATUS | |||
| Occupied Map | 271,902 | 3,745,155 | 116,716,292 |
| Vacant Map | 30,952 | 582,373 | 14,988,438 |
| HOUSING UNITS, OCCUPIED, TENURE | |||
| Owned with a mortgage or a loan Map | 125,360 | 1,741,905 | 52,979,430 |
| Owned free and clear Map | 49,825 | 755,995 | 23,006,644 |
| Renter occupied Map | 96,717 | 1,247,255 | 40,730,218 |
| HOUSING UNITS, VACANT, VACANCY STATUS | |||
| For rent Map | 10,466 | 156,587 | 4,137,567 |
| Rented, not occupied Map | 440 | 6,671 | 206,825 |
| For sale only Map | 4,667 | 71,693 | 1,896,796 |
| Sold, not occupied Map | 857 | 14,510 | 421,032 |
| For seasonal, recreational, or occasional use Map | 2,751 | 191,508 | 4,649,298 |
| For migrant workers Map | 308 | 1,620 | 24,161 |
| Other vacant Map | 11,463 | 139,784 | 3,652,759 |
| HOUSING UNITS, OCCUPIED, AVERAGE HOUSEHOLD SIZE BY TENURE | |||
| Total: Map | 2.61 | 2.48 | 2.58 |
| Owner occupied Map | 2.60 | 2.52 | 2.65 |
| Renter occupied Map | 2.61 | 2.40 | 2.44 |
| HOUSING UNITS, OCCUPIED, TENURE BY RACE OF HOUSEHOLDER | |||
| Owner occupied: Map | 175,185 | 2,497,900 | 75,986,074 |
| Householder who is White alone Map | 124,512 | 1,988,231 | 63,446,275 |
| Householder who is Black or African American alone Map | 41,186 | 380,844 | 6,261,464 |
| Householder who is American Indian and Alaska Native alone Map | 1,078 | 27,969 | 509,588 |
| Householder who is Asian alone Map | 1,421 | 38,608 | 2,688,861 |
| Householder who is Native Hawaiian and Other Pacific Islander alone Map | 105 | 858 | 61,911 |
| Householder who is Some Other Race alone Map | 4,928 | 38,578 | 1,975,817 |
| Householder who is Two or More Races Map | 1,955 | 22,812 | 1,042,158 |
| Renter occupied: Map | 96,717 | 1,247,255 | 40,730,218 |
| Householder who is White alone Map | 48,886 | 716,243 | 26,308,077 |
| Householder who is Black or African American alone Map | 36,698 | 401,277 | 7,868,519 |
| Householder who is American Indian and Alaska Native alone Map | 843 | 14,928 | 430,119 |
| Householder who is Asian alone Map | 1,156 | 25,550 | 1,943,303 |
| Householder who is Native Hawaiian and Other Pacific Islander alone Map | 147 | 1,145 | 82,021 |
| Householder who is Some Other Race alone Map | 6,839 | 63,495 | 2,940,610 |
| Householder who is Two or More Races Map | 2,148 | 24,617 | 1,157,569 |
| HOUSING UNITS, OCCUPIED, TENURE BY HISPANIC OR LATINO ORIGIN OF HOUSEHOLDER | |||
| Owner occupied: Map | 175,185 | 2,497,900 | 75,986,074 |
| Not Hispanic or Latino householder Map | 165,380 | 2,411,517 | 69,617,625 |
| Hispanic or Latino householder Map | 9,805 | 86,383 | 6,368,449 |
| Renter occupied: Map | 96,717 | 1,247,255 | 40,730,218 |
| Not Hispanic or Latino householder Map | 84,475 | 1,132,210 | 33,637,301 |
| Hispanic or Latino householder Map | 12,242 | 115,045 | 7,092,917 |
| HOUSING UNITS, OCCUPIED, TENURE BY HOUSEHOLD SIZE | |||
| Owner occupied: Map | 175,185 | 2,497,900 | 75,986,074 |
| 1-person household Map | 38,004 | 567,073 | 16,453,569 |
| 2-person household Map | 63,626 | 951,836 | 27,618,605 |
| 3-person household Map | 31,395 | 424,704 | 12,517,563 |
| 4-person household Map | 24,971 | 343,576 | 10,998,793 |
| 5-person household Map | 10,860 | 138,065 | 5,057,765 |
| 6-person household Map | 4,004 | 47,014 | 1,965,796 |
| 7-or-more-person household Map | 2,325 | 25,632 | 1,373,983 |
| Renter occupied: Map | 96,717 | 1,247,255 | 40,730,218 |
| 1-person household Map | 30,029 | 444,275 | 14,751,340 |
| 2-person household Map | 24,122 | 336,098 | 10,624,023 |
| 3-person household Map | 17,085 | 202,731 | 6,240,422 |
| 4-person household Map | 13,221 | 143,393 | 4,626,453 |
| 5-person household Map | 7,014 | 71,252 | 2,480,866 |
| 6-person household Map | 3,136 | 29,628 | 1,108,903 |
| 7-or-more-person household Map | 2,110 | 19,878 | 898,211 |
Loading...