


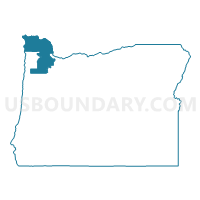
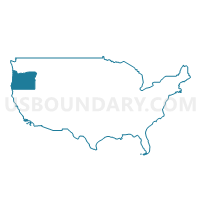
Congressional District 1, Oregon
About
Outline

Summary
| Unique Area Identifier | 118766 |
| Name | Congressional District 1 |
| State | Oregon |
| Area (square miles) | 3,235.85 |
| Land Area (square miles) | 2,944.45 |
| Water Area (square miles) | 291.40 |
| % of Land Area | 90.99 |
| % of Water Area | 9.01 |
| Latitude of the Internal Point | 45.72051550 |
| Longtitude of the Internal Point | -123.35214210 |
| Total Population | 802,570 |
| Total Housing Units | 343,010 |
| Total Households | 316,857 |
| Median Age | 36.3 |
Maps
Graphs
Select a template below for downloading or customizing gragh for Congressional District 1, Oregon


Neighbors
Neighoring 111th Congressional District (by Name) Neighboring 111th Congressional District on the Map
Top 10 Neighboring County (by Population) Neighboring County on the Map
- Multnomah County, OR (735,334)
- Washington County, OR (529,710)
- Clark County, WA (425,363)
- Clackamas County, OR (375,992)
- Marion County, OR (315,335)
- Cowlitz County, WA (102,410)
- Yamhill County, OR (99,193)
- Polk County, OR (75,403)
- Columbia County, OR (49,351)
- Clatsop County, OR (37,039)
Top 10 Neighboring County Subdivision (by Population) Neighboring County Subdivision on the Map
- Portland East CCD, Multnomah County, OR (462,994)
- Beaverton-Hillsboro CCD, Washington County, OR (404,973)
- Northwest Clackamas CCD, Clackamas County, OR (248,731)
- Salem CCD, Marion County, OR (224,401)
- Vancouver CCD, Clark County, WA (219,580)
- Portland West CCD, Multnomah County, OR (125,084)
- Rockcreek CCD, Washington County, OR (69,001)
- Longview-Kelso CCD, Cowlitz County, WA (63,510)
- Newberg CCD, Yamhill County, OR (37,156)
- Forest Grove-Cornelius CCD, Washington County, OR (37,133)
Top 10 Neighboring Place (by Population) Neighboring Place on the Map
- Portland city, OR (583,776)
- Hillsboro city, OR (91,611)
- Beaverton city, OR (89,803)
- Aloha CDP, OR (49,425)
- Tigard city, OR (48,035)
- Lake Oswego city, OR (36,619)
- McMinnville city, OR (32,187)
- Tualatin city, OR (26,054)
- Newberg city, OR (22,068)
- Forest Grove city, OR (21,083)
Top 10 Neighboring Unified School District (by Population) Neighboring Unified School District on the Map
- Portland School District 1J, OR (459,982)
- Beaverton School District 48J, OR (255,082)
- Salem-Keizer School District 24J, OR (242,521)
- Vancouver Public Schools, WA (142,811)
- Hillsboro School District 1J, OR (125,462)
- Tigard-Tualatin School District 23J, OR (78,274)
- Longview Public Schools, WA (45,370)
- West Linn School District 3J, OR (45,262)
- Lake Oswego School District 7J, OR (40,616)
- McMinnville School District 40, OR (39,623)
Top 10 Neighboring State Legislative District Lower Chamber (by Population) Neighboring State Legislative District Lower Chamber on the Map
- State House District 18, WA (160,083)
- State House District 49, WA (134,779)
- State House District 19, WA (126,904)
- State House District 33, OR (79,509)
- State House District 26, OR (76,186)
- State House District 30, OR (74,832)
- State House District 24, OR (66,002)
- State House District 35, OR (65,721)
- State House District 29, OR (65,597)
- State House District 34, OR (65,504)
Top 10 Neighboring State Legislative District Upper Chamber (by Population) Neighboring State Legislative District Upper Chamber on the Map
- State Senate District 18, WA (160,083)
- State Senate District 17, OR (145,013)
- State Senate District 13, OR (141,274)
- State Senate District 15, OR (140,429)
- State Senate District 49, WA (134,779)
- State Senate District 18, OR (129,443)
- State Senate District 12, OR (128,429)
- State Senate District 19, WA (126,904)
- State Senate District 14, OR (126,140)
- State Senate District 9, OR (123,674)
Top 10 Neighboring Census Tract (by Population) Neighboring Census Tract on the Map
- Census Tract 315.13, Washington County, OR (11,399)
- Census Tract 321.03, Washington County, OR (10,190)
- Census Tract 303.01, Yamhill County, OR (9,628)
- Census Tract 53, Polk County, OR (8,580)
- Census Tract 324.06, Washington County, OR (8,505)
- Census Tract 316.09, Washington County, OR (8,468)
- Census Tract 317.04, Washington County, OR (8,379)
- Census Tract 70, Multnomah County, OR (8,181)
- Census Tract 319.10, Washington County, OR (7,993)
- Census Tract 51, Multnomah County, OR (7,926)
Top 10 Neighboring 5-Digit ZIP Code Tabulation Area (by Population) Neighboring 5-Digit ZIP Code Tabulation Area on the Map
- 97007, OR (66,954)
- 97006, OR (63,036)
- 97229, OR (58,217)
- 98632, WA (49,205)
- 97124, OR (48,349)
- 97223, OR (46,699)
- 97123, OR (44,537)
- 97202, OR (38,762)
- 97219, OR (38,709)
- 97303, OR (38,663)
Data
Demographic, Population, Households, and Housing Units
** Data sources from census 2010 **
Show Data on Map
Download Full List as CSV
Download Quick Sheet as CSV
| Subject | This Area | Oregon | National |
|---|---|---|---|
| POPULATION | |||
| Total Population Map | 802,570 | 3,831,074 | 308,745,538 |
| POPULATION, HISPANIC OR LATINO ORIGIN | |||
| Not Hispanic or Latino Map | 695,666 | 3,381,012 | 258,267,944 |
| Hispanic or Latino Map | 106,904 | 450,062 | 50,477,594 |
| POPULATION, RACE | |||
| White alone Map | 644,727 | 3,204,614 | 223,553,265 |
| Black or African American alone Map | 13,071 | 69,206 | 38,929,319 |
| American Indian and Alaska Native alone Map | 7,132 | 53,203 | 2,932,248 |
| Asian alone Map | 52,873 | 141,263 | 14,674,252 |
| Native Hawaiian and Other Pacific Islander alone Map | 2,991 | 13,404 | 540,013 |
| Some Other Race alone Map | 49,789 | 204,625 | 19,107,368 |
| Two or More Races Map | 31,987 | 144,759 | 9,009,073 |
| POPULATION, SEX | |||
| Male Map | 398,520 | 1,896,002 | 151,781,326 |
| Female Map | 404,050 | 1,935,072 | 156,964,212 |
| POPULATION, AGE (18 YEARS) | |||
| 18 years and over Map | 612,061 | 2,964,621 | 234,564,071 |
| Under 18 years | 190,509 | 866,453 | 74,181,467 |
| POPULATION, AGE | |||
| Under 5 years | 52,733 | 237,556 | 20,201,362 |
| 5 to 9 years | 53,282 | 237,214 | 20,348,657 |
| 10 to 14 years | 52,862 | 242,553 | 20,677,194 |
| 15 to 17 years | 31,632 | 149,130 | 12,954,254 |
| 18 and 19 years | 19,926 | 105,730 | 9,086,089 |
| 20 years | 9,621 | 52,462 | 4,519,129 |
| 21 years | 9,512 | 50,575 | 4,354,294 |
| 22 to 24 years | 32,473 | 150,011 | 12,712,576 |
| 25 to 29 years | 62,296 | 265,033 | 21,101,849 |
| 30 to 34 years | 61,132 | 259,111 | 19,962,099 |
| 35 to 39 years | 59,442 | 251,163 | 20,179,642 |
| 40 to 44 years | 57,542 | 248,362 | 20,890,964 |
| 45 to 49 years | 57,229 | 262,879 | 22,708,591 |
| 50 to 54 years | 56,552 | 276,196 | 22,298,125 |
| 55 to 59 years | 52,612 | 273,423 | 19,664,805 |
| 60 and 61 years | 18,641 | 100,551 | 7,113,727 |
| 62 to 64 years | 24,970 | 135,592 | 9,704,197 |
| 65 and 66 years | 13,086 | 73,650 | 5,319,902 |
| 67 to 69 years | 16,398 | 96,197 | 7,115,361 |
| 70 to 74 years | 19,477 | 120,194 | 9,278,166 |
| 75 to 79 years | 14,878 | 91,601 | 7,317,795 |
| 80 to 84 years | 12,534 | 74,019 | 5,743,327 |
| 85 years and over | 13,740 | 77,872 | 5,493,433 |
| MEDIAN AGE BY SEX | |||
| Both sexes Map | 36.30 | 38.40 | 37.20 |
| Male Map | 35.60 | 37.30 | 35.80 |
| Female Map | 37.20 | 39.50 | 38.50 |
| HOUSEHOLDS | |||
| Total Households Map | 316,857 | 1,518,938 | 116,716,292 |
| HOUSEHOLDS, HOUSEHOLD TYPE | |||
| Family households: Map | 198,829 | 963,467 | 77,538,296 |
| Husband-wife family Map | 155,804 | 733,741 | 56,510,377 |
| Other family: Map | 43,025 | 229,726 | 21,027,919 |
| Male householder, no wife present Map | 13,464 | 70,921 | 5,777,570 |
| Female householder, no husband present Map | 29,561 | 158,805 | 15,250,349 |
| Nonfamily households: Map | 118,028 | 555,471 | 39,177,996 |
| Householder living alone Map | 90,929 | 416,747 | 31,204,909 |
| Householder not living alone Map | 27,099 | 138,724 | 7,973,087 |
| HOUSEHOLDS, HISPANIC OR LATINO ORIGIN OF HOUSEHOLDER | |||
| Not Hispanic or Latino householder: Map | 290,556 | 1,409,055 | 103,254,926 |
| Hispanic or Latino householder: Map | 26,301 | 109,883 | 13,461,366 |
| HOUSEHOLDS, RACE OF HOUSEHOLDER | |||
| Householder who is White alone | 270,788 | 1,339,740 | 89,754,352 |
| Householder who is Black or African American alone | 4,720 | 24,638 | 14,129,983 |
| Householder who is American Indian and Alaska Native alone | 2,444 | 17,811 | 939,707 |
| Householder who is Asian alone | 18,025 | 45,466 | 4,632,164 |
| Householder who is Native Hawaiian and Other Pacific Islander alone | 882 | 3,647 | 143,932 |
| Householder who is Some Other Race alone | 12,100 | 50,154 | 4,916,427 |
| Householder who is Two or More Races | 7,898 | 37,482 | 2,199,727 |
| HOUSEHOLDS, HOUSEHOLD TYPE BY HOUSEHOLD SIZE | |||
| Family households: Map | 198,829 | 963,467 | 77,538,296 |
| 2-person household Map | 84,096 | 438,909 | 31,882,616 |
| 3-person household Map | 45,061 | 211,114 | 17,765,829 |
| 4-person household Map | 40,480 | 175,719 | 15,214,075 |
| 5-person household Map | 17,632 | 81,168 | 7,411,997 |
| 6-person household Map | 6,982 | 33,409 | 3,026,278 |
| 7-or-more-person household Map | 4,578 | 23,148 | 2,237,501 |
| Nonfamily households: Map | 118,028 | 555,471 | 39,177,996 |
| 1-person household Map | 90,929 | 416,747 | 31,204,909 |
| 2-person household Map | 22,434 | 109,435 | 6,360,012 |
| 3-person household Map | 3,106 | 18,159 | 992,156 |
| 4-person household Map | 989 | 7,031 | 411,171 |
| 5-person household Map | 347 | 2,621 | 126,634 |
| 6-person household Map | 144 | 920 | 48,421 |
| 7-or-more-person household Map | 79 | 558 | 34,693 |
| HOUSING UNITS | |||
| Total Housing Units Map | 343,010 | 1,675,562 | 131,704,730 |
| HOUSING UNITS, OCCUPANCY STATUS | |||
| Occupied Map | 316,857 | 1,518,938 | 116,716,292 |
| Vacant Map | 26,153 | 156,624 | 14,988,438 |
| HOUSING UNITS, OCCUPIED, TENURE | |||
| Owned with a mortgage or a loan Map | 147,722 | 678,120 | 52,979,430 |
| Owned free and clear Map | 41,769 | 266,365 | 23,006,644 |
| Renter occupied Map | 127,366 | 574,453 | 40,730,218 |
| HOUSING UNITS, VACANT, VACANCY STATUS | |||
| For rent Map | 9,087 | 40,193 | 4,137,567 |
| Rented, not occupied Map | 648 | 2,608 | 206,825 |
| For sale only Map | 4,656 | 24,191 | 1,896,796 |
| Sold, not occupied Map | 764 | 4,401 | 421,032 |
| For seasonal, recreational, or occasional use Map | 7,142 | 55,473 | 4,649,298 |
| For migrant workers Map | 90 | 461 | 24,161 |
| Other vacant Map | 3,766 | 29,297 | 3,652,759 |
| HOUSING UNITS, OCCUPIED, AVERAGE HOUSEHOLD SIZE BY TENURE | |||
| Total: Map | 2.47 | 2.47 | 2.58 |
| Owner occupied Map | 2.63 | 2.53 | 2.65 |
| Renter occupied Map | 2.24 | 2.36 | 2.44 |
| HOUSING UNITS, OCCUPIED, TENURE BY RACE OF HOUSEHOLDER | |||
| Owner occupied: Map | 189,491 | 944,485 | 75,986,074 |
| Householder who is White alone Map | 168,396 | 862,700 | 63,446,275 |
| Householder who is Black or African American alone Map | 1,403 | 8,106 | 6,261,464 |
| Householder who is American Indian and Alaska Native alone Map | 1,026 | 8,471 | 509,588 |
| Householder who is Asian alone Map | 11,169 | 28,280 | 2,688,861 |
| Householder who is Native Hawaiian and Other Pacific Islander alone Map | 306 | 1,196 | 61,911 |
| Householder who is Some Other Race alone Map | 3,832 | 18,640 | 1,975,817 |
| Householder who is Two or More Races Map | 3,359 | 17,092 | 1,042,158 |
| Renter occupied: Map | 127,366 | 574,453 | 40,730,218 |
| Householder who is White alone Map | 102,392 | 477,040 | 26,308,077 |
| Householder who is Black or African American alone Map | 3,317 | 16,532 | 7,868,519 |
| Householder who is American Indian and Alaska Native alone Map | 1,418 | 9,340 | 430,119 |
| Householder who is Asian alone Map | 6,856 | 17,186 | 1,943,303 |
| Householder who is Native Hawaiian and Other Pacific Islander alone Map | 576 | 2,451 | 82,021 |
| Householder who is Some Other Race alone Map | 8,268 | 31,514 | 2,940,610 |
| Householder who is Two or More Races Map | 4,539 | 20,390 | 1,157,569 |
| HOUSING UNITS, OCCUPIED, TENURE BY HISPANIC OR LATINO ORIGIN OF HOUSEHOLDER | |||
| Owner occupied: Map | 189,491 | 944,485 | 75,986,074 |
| Not Hispanic or Latino householder Map | 180,194 | 900,276 | 69,617,625 |
| Hispanic or Latino householder Map | 9,297 | 44,209 | 6,368,449 |
| Renter occupied: Map | 127,366 | 574,453 | 40,730,218 |
| Not Hispanic or Latino householder Map | 110,362 | 508,779 | 33,637,301 |
| Hispanic or Latino householder Map | 17,004 | 65,674 | 7,092,917 |
| HOUSING UNITS, OCCUPIED, TENURE BY HOUSEHOLD SIZE | |||
| Owner occupied: Map | 189,491 | 944,485 | 75,986,074 |
| 1-person household Map | 38,934 | 205,782 | 16,453,569 |
| 2-person household Map | 71,422 | 387,395 | 27,618,605 |
| 3-person household Map | 31,278 | 144,798 | 12,517,563 |
| 4-person household Map | 29,217 | 121,269 | 10,998,793 |
| 5-person household Map | 11,556 | 51,153 | 5,057,765 |
| 6-person household Map | 4,328 | 20,219 | 1,965,796 |
| 7-or-more-person household Map | 2,756 | 13,869 | 1,373,983 |
| Renter occupied: Map | 127,366 | 574,453 | 40,730,218 |
| 1-person household Map | 51,995 | 210,965 | 14,751,340 |
| 2-person household Map | 35,108 | 160,949 | 10,624,023 |
| 3-person household Map | 16,889 | 84,475 | 6,240,422 |
| 4-person household Map | 12,252 | 61,481 | 4,626,453 |
| 5-person household Map | 6,423 | 32,636 | 2,480,866 |
| 6-person household Map | 2,798 | 14,110 | 1,108,903 |
| 7-or-more-person household Map | 1,901 | 9,837 | 898,211 |
Loading...