


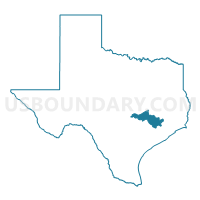
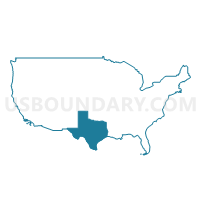
Congressional District 10, Texas
About
Outline

Summary
| Unique Area Identifier | 119075 |
| Name | Congressional District 10 |
| State | Texas |
| Area (square miles) | 3,846.02 |
| Land Area (square miles) | 3,783.61 |
| Water Area (square miles) | 62.40 |
| % of Land Area | 98.38 |
| % of Water Area | 1.62 |
| Latitude of the Internal Point | 30.17466110 |
| Longtitude of the Internal Point | -96.53580060 |
| Total Population | 981,367 |
| Total Housing Units | 382,736 |
| Total Households | 352,057 |
| Median Age | 33.3 |
Maps
Graphs
Select a template below for downloading or customizing gragh for Congressional District 10, Texas


Neighbors
Neighoring 111th Congressional District (by Name) Neighboring 111th Congressional District on the Map
- Congressional District 14, TX
- Congressional District 17, TX
- Congressional District 2, TX
- Congressional District 21, TX
- Congressional District 25, TX
- Congressional District 31, TX
- Congressional District 7, TX
- Congressional District 8, TX
- Congressional District 9, TX
Top 10 Neighboring County (by Population) Neighboring County on the Map
- Harris County, TX (4,092,459)
- Travis County, TX (1,024,266)
- Fort Bend County, TX (585,375)
- Montgomery County, TX (455,746)
- Williamson County, TX (422,679)
- Brazos County, TX (194,851)
- Bastrop County, TX (74,171)
- Waller County, TX (43,205)
- Wharton County, TX (41,280)
- Washington County, TX (33,718)
Top 10 Neighboring County Subdivision (by Population) Neighboring County Subdivision on the Map
- Houston CCD, Harris County, TX (3,075,388)
- Austin CCD, Travis County, TX (774,229)
- Northwest Harris CCD, Harris County, TX (651,299)
- Southeast Montgomery CCD, Montgomery County, TX (318,202)
- Round Rock-Georgetown CCD, Williamson County, TX (239,526)
- Fulshear-Simonton CCD, Fort Bend County, TX (102,849)
- Northeast Travis CCD, Travis County, TX (100,175)
- Northwest Travis CCD, Travis County, TX (96,420)
- Taylor CCD, Williamson County, TX (53,986)
- Southwest Travis CCD, Travis County, TX (53,442)
Top 10 Neighboring Place (by Population) Neighboring Place on the Map
- Houston city, TX (2,099,451)
- Austin city, TX (790,390)
- Round Rock city, TX (99,887)
- The Woodlands CDP, TX (93,847)
- Pflugerville city, TX (46,936)
- Cinco Ranch CDP, TX (18,274)
- Jollyville CDP, TX (16,151)
- Brenham city, TX (15,716)
- Katy city, TX (14,102)
- Wells Branch CDP, TX (12,120)
Top 10 Neighboring Elementary School District (by Population) Neighboring Elementary School District on the Map
Top 10 Neighboring Secondary School District (by Population) Neighboring Secondary School District on the Map
Top 10 Neighboring Unified School District (by Population) Neighboring Unified School District on the Map
- Austin Independent School District, TX (636,113)
- Cypress-Fairbanks Independent School District, TX (496,751)
- Fort Bend Independent School District, TX (348,526)
- Conroe Independent School District, TX (258,544)
- Katy Independent School District, TX (256,979)
- Alief Independent School District, TX (256,592)
- Round Rock Independent School District, TX (231,853)
- Klein Independent School District, TX (217,773)
- Leander Independent School District, TX (146,557)
- Lamar Consolidated Independent School District, TX (122,887)
Top 10 Neighboring State Legislative District Lower Chamber (by Population) Neighboring State Legislative District Lower Chamber on the Map
- State House District 132, TX (264,426)
- State House District 28, TX (263,682)
- State House District 130, TX (252,386)
- State House District 20, TX (228,091)
- State House District 15, TX (222,505)
- State House District 52, TX (219,345)
- State House District 150, TX (212,484)
- State House District 47, TX (198,311)
- State House District 50, TX (191,756)
- State House District 14, TX (182,078)
Top 10 Neighboring State Legislative District Upper Chamber (by Population) Neighboring State Legislative District Upper Chamber on the Map
- State Senate District 7, TX (1,015,027)
- State Senate District 5, TX (899,155)
- State Senate District 14, TX (872,176)
- State Senate District 18, TX (861,831)
- State Senate District 17, TX (847,887)
- State Senate District 3, TX (818,359)
- State Senate District 4, TX (790,149)
Top 10 Neighboring Census Tract (by Population) Neighboring Census Tract on the Map
- Census Tract 6731.01, Fort Bend County, TX (33,201)
- Census Tract 6906.02, Montgomery County, TX (18,616)
- Census Tract 5421.01, Harris County, TX (17,754)
- Census Tract 5555.02, Harris County, TX (17,016)
- Census Tract 5430.03, Harris County, TX (16,578)
- Census Tract 5422, Harris County, TX (16,532)
- Census Tract 18.41, Travis County, TX (16,495)
- Census Tract 6904.02, Montgomery County, TX (15,781)
- Census Tract 18.58, Travis County, TX (15,316)
- Census Tract 5420, Harris County, TX (15,167)
Top 10 Neighboring 5-Digit ZIP Code Tabulation Area (by Population) Neighboring 5-Digit ZIP Code Tabulation Area on the Map
- 77084, TX (95,137)
- 77449, TX (94,382)
- 77429, TX (72,264)
- 77450, TX (71,889)
- 77379, TX (70,544)
- 78660, TX (68,789)
- 77095, TX (66,502)
- 77494, TX (61,600)
- 78664, TX (52,932)
- 77077, TX (52,151)
Data
Demographic, Population, Households, and Housing Units
** Data sources from census 2010 **
Show Data on Map
Download Full List as CSV
Download Quick Sheet as CSV
| Subject | This Area | Texas | National |
|---|---|---|---|
| POPULATION | |||
| Total Population Map | 981,367 | 25,145,561 | 308,745,538 |
| POPULATION, HISPANIC OR LATINO ORIGIN | |||
| Not Hispanic or Latino Map | 698,726 | 15,684,640 | 258,267,944 |
| Hispanic or Latino Map | 282,641 | 9,460,921 | 50,477,594 |
| POPULATION, RACE | |||
| White alone Map | 676,833 | 17,701,552 | 223,553,265 |
| Black or African American alone Map | 111,799 | 2,979,598 | 38,929,319 |
| American Indian and Alaska Native alone Map | 6,547 | 170,972 | 2,932,248 |
| Asian alone Map | 57,124 | 964,596 | 14,674,252 |
| Native Hawaiian and Other Pacific Islander alone Map | 676 | 21,656 | 540,013 |
| Some Other Race alone Map | 98,066 | 2,628,186 | 19,107,368 |
| Two or More Races Map | 30,322 | 679,001 | 9,009,073 |
| POPULATION, SEX | |||
| Male Map | 487,238 | 12,472,280 | 151,781,326 |
| Female Map | 494,129 | 12,673,281 | 156,964,212 |
| POPULATION, AGE (18 YEARS) | |||
| 18 years and over Map | 707,472 | 18,279,737 | 234,564,071 |
| Under 18 years | 273,895 | 6,865,824 | 74,181,467 |
| POPULATION, AGE | |||
| Under 5 years | 76,413 | 1,928,473 | 20,201,362 |
| 5 to 9 years | 77,521 | 1,928,234 | 20,348,657 |
| 10 to 14 years | 75,575 | 1,881,883 | 20,677,194 |
| 15 to 17 years | 44,386 | 1,127,234 | 12,954,254 |
| 18 and 19 years | 26,449 | 755,890 | 9,086,089 |
| 20 years | 11,855 | 369,040 | 4,519,129 |
| 21 years | 11,622 | 359,015 | 4,354,294 |
| 22 to 24 years | 38,948 | 1,089,024 | 12,712,576 |
| 25 to 29 years | 76,215 | 1,853,039 | 21,101,849 |
| 30 to 34 years | 77,782 | 1,760,434 | 19,962,099 |
| 35 to 39 years | 77,990 | 1,763,587 | 20,179,642 |
| 40 to 44 years | 72,972 | 1,694,795 | 20,890,964 |
| 45 to 49 years | 71,527 | 1,760,467 | 22,708,591 |
| 50 to 54 years | 67,164 | 1,674,869 | 22,298,125 |
| 55 to 59 years | 54,776 | 1,422,924 | 19,664,805 |
| 60 and 61 years | 18,062 | 500,523 | 7,113,727 |
| 62 to 64 years | 23,599 | 674,244 | 9,704,197 |
| 65 and 66 years | 12,489 | 373,062 | 5,319,902 |
| 67 to 69 years | 15,281 | 480,038 | 7,115,361 |
| 70 to 74 years | 18,041 | 619,156 | 9,278,166 |
| 75 to 79 years | 13,466 | 477,245 | 7,317,795 |
| 80 to 84 years | 9,961 | 347,206 | 5,743,327 |
| 85 years and over | 9,273 | 305,179 | 5,493,433 |
| MEDIAN AGE BY SEX | |||
| Both sexes Map | 33.30 | 33.60 | 37.20 |
| Male Map | 32.60 | 32.60 | 35.80 |
| Female Map | 34.00 | 34.60 | 38.50 |
| HOUSEHOLDS | |||
| Total Households Map | 352,057 | 8,922,933 | 116,716,292 |
| HOUSEHOLDS, HOUSEHOLD TYPE | |||
| Family households: Map | 245,961 | 6,237,148 | 77,538,296 |
| Husband-wife family Map | 189,180 | 4,515,013 | 56,510,377 |
| Other family: Map | 56,781 | 1,722,135 | 21,027,919 |
| Male householder, no wife present Map | 16,767 | 467,431 | 5,777,570 |
| Female householder, no husband present Map | 40,014 | 1,254,704 | 15,250,349 |
| Nonfamily households: Map | 106,096 | 2,685,785 | 39,177,996 |
| Householder living alone Map | 82,474 | 2,163,266 | 31,204,909 |
| Householder not living alone Map | 23,622 | 522,519 | 7,973,087 |
| HOUSEHOLDS, HISPANIC OR LATINO ORIGIN OF HOUSEHOLDER | |||
| Not Hispanic or Latino householder: Map | 276,554 | 6,308,776 | 103,254,926 |
| Hispanic or Latino householder: Map | 75,503 | 2,614,157 | 13,461,366 |
| HOUSEHOLDS, RACE OF HOUSEHOLDER | |||
| Householder who is White alone | 259,985 | 6,570,152 | 89,754,352 |
| Householder who is Black or African American alone | 38,413 | 1,088,836 | 14,129,983 |
| Householder who is American Indian and Alaska Native alone | 2,013 | 57,265 | 939,707 |
| Householder who is Asian alone | 18,187 | 307,373 | 4,632,164 |
| Householder who is Native Hawaiian and Other Pacific Islander alone | 213 | 6,353 | 143,932 |
| Householder who is Some Other Race alone | 25,831 | 714,396 | 4,916,427 |
| Householder who is Two or More Races | 7,415 | 178,558 | 2,199,727 |
| HOUSEHOLDS, HOUSEHOLD TYPE BY HOUSEHOLD SIZE | |||
| Family households: Map | 245,961 | 6,237,148 | 77,538,296 |
| 2-person household Map | 87,512 | 2,283,002 | 31,882,616 |
| 3-person household Map | 56,677 | 1,417,977 | 17,765,829 |
| 4-person household Map | 54,511 | 1,286,463 | 15,214,075 |
| 5-person household Map | 27,911 | 709,450 | 7,411,997 |
| 6-person household Map | 11,414 | 307,995 | 3,026,278 |
| 7-or-more-person household Map | 7,936 | 232,261 | 2,237,501 |
| Nonfamily households: Map | 106,096 | 2,685,785 | 39,177,996 |
| 1-person household Map | 82,474 | 2,163,266 | 31,204,909 |
| 2-person household Map | 19,317 | 420,415 | 6,360,012 |
| 3-person household Map | 2,799 | 64,352 | 992,156 |
| 4-person household Map | 1,022 | 26,532 | 411,171 |
| 5-person household Map | 305 | 6,926 | 126,634 |
| 6-person household Map | 113 | 2,610 | 48,421 |
| 7-or-more-person household Map | 66 | 1,684 | 34,693 |
| HOUSING UNITS | |||
| Total Housing Units Map | 382,736 | 9,977,436 | 131,704,730 |
| HOUSING UNITS, OCCUPANCY STATUS | |||
| Occupied Map | 352,057 | 8,922,933 | 116,716,292 |
| Vacant Map | 30,679 | 1,054,503 | 14,988,438 |
| HOUSING UNITS, OCCUPIED, TENURE | |||
| Owned with a mortgage or a loan Map | 180,628 | 3,728,987 | 52,979,430 |
| Owned free and clear Map | 55,232 | 1,956,366 | 23,006,644 |
| Renter occupied Map | 116,197 | 3,237,580 | 40,730,218 |
| HOUSING UNITS, VACANT, VACANCY STATUS | |||
| For rent Map | 11,712 | 394,310 | 4,137,567 |
| Rented, not occupied Map | 597 | 16,509 | 206,825 |
| For sale only Map | 4,896 | 121,430 | 1,896,796 |
| Sold, not occupied Map | 1,003 | 30,437 | 421,032 |
| For seasonal, recreational, or occasional use Map | 5,317 | 208,733 | 4,649,298 |
| For migrant workers Map | 42 | 2,209 | 24,161 |
| Other vacant Map | 7,112 | 280,875 | 3,652,759 |
| HOUSING UNITS, OCCUPIED, AVERAGE HOUSEHOLD SIZE BY TENURE | |||
| Total: Map | 2.76 | 2.75 | 2.58 |
| Owner occupied Map | 2.91 | 2.87 | 2.65 |
| Renter occupied Map | 2.44 | 2.54 | 2.44 |
| HOUSING UNITS, OCCUPIED, TENURE BY RACE OF HOUSEHOLDER | |||
| Owner occupied: Map | 235,860 | 5,685,353 | 75,986,074 |
| Householder who is White alone Map | 184,524 | 4,517,967 | 63,446,275 |
| Householder who is Black or African American alone Map | 20,364 | 486,371 | 6,261,464 |
| Householder who is American Indian and Alaska Native alone Map | 1,168 | 32,734 | 509,588 |
| Householder who is Asian alone Map | 11,944 | 190,121 | 2,688,861 |
| Householder who is Native Hawaiian and Other Pacific Islander alone Map | 119 | 3,003 | 61,911 |
| Householder who is Some Other Race alone Map | 13,579 | 361,514 | 1,975,817 |
| Householder who is Two or More Races Map | 4,162 | 93,643 | 1,042,158 |
| Renter occupied: Map | 116,197 | 3,237,580 | 40,730,218 |
| Householder who is White alone Map | 75,461 | 2,052,185 | 26,308,077 |
| Householder who is Black or African American alone Map | 18,049 | 602,465 | 7,868,519 |
| Householder who is American Indian and Alaska Native alone Map | 845 | 24,531 | 430,119 |
| Householder who is Asian alone Map | 6,243 | 117,252 | 1,943,303 |
| Householder who is Native Hawaiian and Other Pacific Islander alone Map | 94 | 3,350 | 82,021 |
| Householder who is Some Other Race alone Map | 12,252 | 352,882 | 2,940,610 |
| Householder who is Two or More Races Map | 3,253 | 84,915 | 1,157,569 |
| HOUSING UNITS, OCCUPIED, TENURE BY HISPANIC OR LATINO ORIGIN OF HOUSEHOLDER | |||
| Owner occupied: Map | 235,860 | 5,685,353 | 75,986,074 |
| Not Hispanic or Latino householder Map | 192,817 | 4,175,029 | 69,617,625 |
| Hispanic or Latino householder Map | 43,043 | 1,510,324 | 6,368,449 |
| Renter occupied: Map | 116,197 | 3,237,580 | 40,730,218 |
| Not Hispanic or Latino householder Map | 83,737 | 2,133,747 | 33,637,301 |
| Hispanic or Latino householder Map | 32,460 | 1,103,833 | 7,092,917 |
| HOUSING UNITS, OCCUPIED, TENURE BY HOUSEHOLD SIZE | |||
| Owner occupied: Map | 235,860 | 5,685,353 | 75,986,074 |
| 1-person household Map | 40,138 | 1,047,772 | 16,453,569 |
| 2-person household Map | 76,438 | 1,900,981 | 27,618,605 |
| 3-person household Map | 42,568 | 975,846 | 12,517,563 |
| 4-person household Map | 42,301 | 911,187 | 10,998,793 |
| 5-person household Map | 20,764 | 486,511 | 5,057,765 |
| 6-person household Map | 8,204 | 207,414 | 1,965,796 |
| 7-or-more-person household Map | 5,447 | 155,642 | 1,373,983 |
| Renter occupied: Map | 116,197 | 3,237,580 | 40,730,218 |
| 1-person household Map | 42,336 | 1,115,494 | 14,751,340 |
| 2-person household Map | 30,391 | 802,436 | 10,624,023 |
| 3-person household Map | 16,908 | 506,483 | 6,240,422 |
| 4-person household Map | 13,232 | 401,808 | 4,626,453 |
| 5-person household Map | 7,452 | 229,865 | 2,480,866 |
| 6-person household Map | 3,323 | 103,191 | 1,108,903 |
| 7-or-more-person household Map | 2,555 | 78,303 | 898,211 |
Loading...