


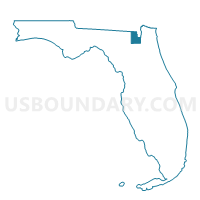
Census Tract 402.01, Baker County, Florida
About
Outline

Summary
| Unique Area Identifier | 447937 |
| Name | Census Tract 402.01 |
| County | Baker County |
| State | Florida |
| Area (square miles) | 410.38 |
| Land Area (square miles) | 406.67 |
| Water Area (square miles) | 3.72 |
| % of Land Area | 99.09 |
| % of Water Area | 0.91 |
| Latitude of the Internal Point | 30.35154440 |
| Longtitude of the Internal Point | -82.36802830 |
| Total Population | 7,519 |
| Total Housing Units | 2,453 |
| Total Households | 2,129 |
| Median Age | 35.3 |
Maps

Graphs
Select a template below for downloading or customizing gragh for Census Tract 402.01, Baker County, Florida


Neighbors
Neighoring Census Tract (by Name) Neighboring Census Tract on the Map
- Census Tract 102, Charlton County, GA
- Census Tract 1103, Columbia County, FL
- Census Tract 401.02, Baker County, FL
- Census Tract 402.02, Baker County, FL
- Census Tract 9508, Ware County, GA
- Census Tract 9601, Union County, FL
- Census Tract 9602, Union County, FL
- Census Tract 9702, Clinch County, GA
Top 10 Neighboring County Subdivision (by Population) Neighboring County Subdivision on the Map
- Lake City CCD, Columbia County, FL (50,281)
- Macclenny CCD, Baker County, FL (14,215)
- Sanderson CCD, Baker County, FL (12,900)
- Lake Butler CCD, Union County, FL (7,319)
- Raiford CCD, Union County, FL (3,721)
- St. George CCD, Charlton County, GA (2,841)
- North Columbia CCD, Columbia County, FL (1,761)
- Fargo CCD, Clinch County, GA (1,559)
- Manor CCD, Ware County, GA (789)
Top 10 Neighboring Unified School District (by Population) Neighboring Unified School District on the Map
- Columbia County School District, FL (67,531)
- Ware County School District, GA (36,312)
- Baker County School District, FL (27,115)
- Union County School District, FL (15,535)
- Charlton County School District, GA (12,171)
- Clinch County School District, GA (6,798)
Top 10 Neighboring State Legislative District Lower Chamber (by Population) Neighboring State Legislative District Lower Chamber on the Map
- State House District 12, FL (159,354)
- State House District 10, FL (151,214)
- State House District 176, GA (56,994)
- State House District 177, GA (48,483)
Top 10 Neighboring State Legislative District Upper Chamber (by Population) Neighboring State Legislative District Upper Chamber on the Map
- State Senate District 3, FL (495,081)
- State Senate District 14, FL (457,489)
- State Senate District 3, GA (175,054)
- State Senate District 7, GA (162,770)
Top 10 Neighboring 111th Congressional District (by Population) Neighboring 111th Congressional District on the Map
Top 10 Neighboring 5-Digit ZIP Code Tabulation Area (by Population) Neighboring 5-Digit ZIP Code Tabulation Area on the Map
- 32025, FL (22,380)
- 32055, FL (16,570)
- 32063, FL (13,429)
- 32054, FL (12,307)
- 32040, FL (7,604)
- 32087, FL (5,518)
- 32083, FL (4,690)
- 31562, GA (2,177)
- 32072, FL (324)
- 32061, FL (283)
Data
Demographic, Population, Households, and Housing Units
** Data sources from census 2010 **
Show Data on Map
Download Full List as CSV
Download Quick Sheet as CSV
| Subject | This Area | Baker County | Florida | National |
|---|---|---|---|---|
| POPULATION | ||||
| Total Population Map | 7,519 | 27,115 | 18,801,310 | 308,745,538 |
| POPULATION, HISPANIC OR LATINO ORIGIN | ||||
| Not Hispanic or Latino Map | 7,416 | 26,595 | 14,577,504 | 258,267,944 |
| Hispanic or Latino Map | 103 | 520 | 4,223,806 | 50,477,594 |
| POPULATION, RACE | ||||
| White alone Map | 5,489 | 22,686 | 14,109,162 | 223,553,265 |
| Black or African American alone Map | 1,873 | 3,680 | 2,999,862 | 38,929,319 |
| American Indian and Alaska Native alone Map | 23 | 76 | 71,458 | 2,932,248 |
| Asian alone Map | 25 | 132 | 454,821 | 14,674,252 |
| Native Hawaiian and Other Pacific Islander alone Map | 2 | 5 | 12,286 | 540,013 |
| Some Other Race alone Map | 15 | 111 | 681,144 | 19,107,368 |
| Two or More Races Map | 92 | 425 | 472,577 | 9,009,073 |
| POPULATION, SEX | ||||
| Male Map | 4,504 | 14,160 | 9,189,355 | 151,781,326 |
| Female Map | 3,015 | 12,955 | 9,611,955 | 156,964,212 |
| POPULATION, AGE (18 YEARS) | ||||
| 18 years and over Map | 5,715 | 20,068 | 14,799,219 | 234,564,071 |
| Under 18 years | 1,804 | 7,047 | 4,002,091 | 74,181,467 |
| POPULATION, AGE | ||||
| Under 5 years | 452 | 1,933 | 1,073,506 | 20,201,362 |
| 5 to 9 years | 515 | 1,991 | 1,080,255 | 20,348,657 |
| 10 to 14 years | 520 | 1,962 | 1,130,847 | 20,677,194 |
| 15 to 17 years | 317 | 1,161 | 717,483 | 12,954,254 |
| 18 and 19 years | 157 | 716 | 510,899 | 9,086,089 |
| 20 years | 77 | 328 | 258,030 | 4,519,129 |
| 21 years | 83 | 355 | 248,602 | 4,354,294 |
| 22 to 24 years | 340 | 1,083 | 722,126 | 12,712,576 |
| 25 to 29 years | 681 | 1,893 | 1,179,227 | 21,101,849 |
| 30 to 34 years | 587 | 1,782 | 1,110,318 | 19,962,099 |
| 35 to 39 years | 554 | 1,853 | 1,178,467 | 20,179,642 |
| 40 to 44 years | 577 | 1,931 | 1,252,787 | 20,890,964 |
| 45 to 49 years | 653 | 2,088 | 1,401,202 | 22,708,591 |
| 50 to 54 years | 552 | 1,930 | 1,340,291 | 22,298,125 |
| 55 to 59 years | 487 | 1,692 | 1,202,418 | 19,664,805 |
| 60 and 61 years | 159 | 635 | 458,751 | 7,113,727 |
| 62 to 64 years | 192 | 826 | 676,499 | 9,704,197 |
| 65 and 66 years | 118 | 488 | 397,917 | 5,319,902 |
| 67 to 69 years | 120 | 575 | 561,316 | 7,115,361 |
| 70 to 74 years | 151 | 766 | 768,707 | 9,278,166 |
| 75 to 79 years | 107 | 520 | 615,514 | 7,317,795 |
| 80 to 84 years | 70 | 368 | 482,023 | 5,743,327 |
| 85 years and over | 50 | 239 | 434,125 | 5,493,433 |
| MEDIAN AGE BY SEX | ||||
| Both sexes Map | 35.30 | 36.00 | 40.70 | 37.20 |
| Male Map | 35.10 | 35.30 | 39.40 | 35.80 |
| Female Map | 35.70 | 36.90 | 42.10 | 38.50 |
| HOUSEHOLDS | ||||
| Total Households Map | 2,129 | 8,772 | 7,420,802 | 116,716,292 |
| HOUSEHOLDS, HOUSEHOLD TYPE | ||||
| Family households: Map | 1,627 | 6,717 | 4,835,475 | 77,538,296 |
| Husband-wife family Map | 1,204 | 4,929 | 3,457,149 | 56,510,377 |
| Other family: Map | 423 | 1,788 | 1,378,326 | 21,027,919 |
| Male householder, no wife present Map | 148 | 544 | 373,284 | 5,777,570 |
| Female householder, no husband present Map | 275 | 1,244 | 1,005,042 | 15,250,349 |
| Nonfamily households: Map | 502 | 2,055 | 2,585,327 | 39,177,996 |
| Householder living alone Map | 413 | 1,697 | 2,021,781 | 31,204,909 |
| Householder not living alone Map | 89 | 358 | 563,546 | 7,973,087 |
| HOUSEHOLDS, HISPANIC OR LATINO ORIGIN OF HOUSEHOLDER | ||||
| Not Hispanic or Latino householder: Map | 2,102 | 8,659 | 6,087,554 | 103,254,926 |
| Hispanic or Latino householder: Map | 27 | 113 | 1,333,248 | 13,461,366 |
| HOUSEHOLDS, RACE OF HOUSEHOLDER | ||||
| Householder who is White alone | 1,755 | 7,786 | 5,918,746 | 89,754,352 |
| Householder who is Black or African American alone | 328 | 788 | 1,005,589 | 14,129,983 |
| Householder who is American Indian and Alaska Native alone | 9 | 33 | 25,704 | 939,707 |
| Householder who is Asian alone | 5 | 31 | 145,808 | 4,632,164 |
| Householder who is Native Hawaiian and Other Pacific Islander alone | 0 | 1 | 3,858 | 143,932 |
| Householder who is Some Other Race alone | 5 | 22 | 192,042 | 4,916,427 |
| Householder who is Two or More Races | 27 | 111 | 129,055 | 2,199,727 |
| HOUSEHOLDS, HOUSEHOLD TYPE BY HOUSEHOLD SIZE | ||||
| Family households: Map | 1,627 | 6,717 | 4,835,475 | 77,538,296 |
| 2-person household Map | 588 | 2,534 | 2,183,933 | 31,882,616 |
| 3-person household Map | 352 | 1,533 | 1,086,320 | 17,765,829 |
| 4-person household Map | 357 | 1,435 | 874,904 | 15,214,075 |
| 5-person household Map | 204 | 732 | 411,851 | 7,411,997 |
| 6-person household Map | 78 | 304 | 165,397 | 3,026,278 |
| 7-or-more-person household Map | 48 | 179 | 113,070 | 2,237,501 |
| Nonfamily households: Map | 502 | 2,055 | 2,585,327 | 39,177,996 |
| 1-person household Map | 413 | 1,697 | 2,021,781 | 31,204,909 |
| 2-person household Map | 77 | 297 | 459,229 | 6,360,012 |
| 3-person household Map | 7 | 43 | 66,366 | 992,156 |
| 4-person household Map | 3 | 12 | 25,473 | 411,171 |
| 5-person household Map | 2 | 4 | 7,379 | 126,634 |
| 6-person household Map | 0 | 0 | 2,998 | 48,421 |
| 7-or-more-person household Map | 0 | 2 | 2,101 | 34,693 |
| HOUSING UNITS | ||||
| Total Housing Units Map | 2,453 | 9,687 | 8,989,580 | 131,704,730 |
| HOUSING UNITS, OCCUPANCY STATUS | ||||
| Occupied Map | 2,129 | 8,772 | 7,420,802 | 116,716,292 |
| Vacant Map | 324 | 915 | 1,568,778 | 14,988,438 |
| HOUSING UNITS, OCCUPIED, TENURE | ||||
| Owned with a mortgage or a loan Map | 991 | 4,258 | 3,348,864 | 52,979,430 |
| Owned free and clear Map | 734 | 2,555 | 1,650,115 | 23,006,644 |
| Renter occupied Map | 404 | 1,959 | 2,421,823 | 40,730,218 |
| HOUSING UNITS, VACANT, VACANCY STATUS | ||||
| For rent Map | 66 | 206 | 371,626 | 4,137,567 |
| Rented, not occupied Map | 3 | 12 | 15,438 | 206,825 |
| For sale only Map | 24 | 143 | 198,232 | 1,896,796 |
| Sold, not occupied Map | 12 | 34 | 31,911 | 421,032 |
| For seasonal, recreational, or occasional use Map | 105 | 173 | 657,070 | 4,649,298 |
| For migrant workers Map | 0 | 0 | 1,541 | 24,161 |
| Other vacant Map | 114 | 347 | 292,960 | 3,652,759 |
| HOUSING UNITS, OCCUPIED, AVERAGE HOUSEHOLD SIZE BY TENURE | ||||
| Total: Map | 2.88 | 2.82 | 2.48 | 2.58 |
| Owner occupied Map | 2.87 | 2.82 | 2.47 | 2.65 |
| Renter occupied Map | 2.92 | 2.83 | 2.49 | 2.44 |
| HOUSING UNITS, OCCUPIED, TENURE BY RACE OF HOUSEHOLDER | ||||
| Owner occupied: Map | 1,725 | 6,813 | 4,998,979 | 75,986,074 |
| Householder who is White alone Map | 1,448 | 6,175 | 4,252,583 | 63,446,275 |
| Householder who is Black or African American alone Map | 240 | 503 | 480,760 | 6,261,464 |
| Householder who is American Indian and Alaska Native alone Map | 9 | 25 | 14,279 | 509,588 |
| Householder who is Asian alone Map | 3 | 23 | 98,804 | 2,688,861 |
| Householder who is Native Hawaiian and Other Pacific Islander alone Map | 0 | 0 | 1,917 | 61,911 |
| Householder who is Some Other Race alone Map | 4 | 12 | 81,491 | 1,975,817 |
| Householder who is Two or More Races Map | 21 | 75 | 69,145 | 1,042,158 |
| Renter occupied: Map | 404 | 1,959 | 2,421,823 | 40,730,218 |
| Householder who is White alone Map | 307 | 1,611 | 1,666,163 | 26,308,077 |
| Householder who is Black or African American alone Map | 88 | 285 | 524,829 | 7,868,519 |
| Householder who is American Indian and Alaska Native alone Map | 0 | 8 | 11,425 | 430,119 |
| Householder who is Asian alone Map | 2 | 8 | 47,004 | 1,943,303 |
| Householder who is Native Hawaiian and Other Pacific Islander alone Map | 0 | 1 | 1,941 | 82,021 |
| Householder who is Some Other Race alone Map | 1 | 10 | 110,551 | 2,940,610 |
| Householder who is Two or More Races Map | 6 | 36 | 59,910 | 1,157,569 |
| HOUSING UNITS, OCCUPIED, TENURE BY HISPANIC OR LATINO ORIGIN OF HOUSEHOLDER | ||||
| Owner occupied: Map | 1,725 | 6,813 | 4,998,979 | 75,986,074 |
| Not Hispanic or Latino householder Map | 1,702 | 6,749 | 4,274,313 | 69,617,625 |
| Hispanic or Latino householder Map | 23 | 64 | 724,666 | 6,368,449 |
| Renter occupied: Map | 404 | 1,959 | 2,421,823 | 40,730,218 |
| Not Hispanic or Latino householder Map | 400 | 1,910 | 1,813,241 | 33,637,301 |
| Hispanic or Latino householder Map | 4 | 49 | 608,582 | 7,092,917 |
| HOUSING UNITS, OCCUPIED, TENURE BY HOUSEHOLD SIZE | ||||
| Owner occupied: Map | 1,725 | 6,813 | 4,998,979 | 75,986,074 |
| 1-person household Map | 311 | 1,182 | 1,227,080 | 16,453,569 |
| 2-person household Map | 571 | 2,372 | 1,975,675 | 27,618,605 |
| 3-person household Map | 284 | 1,209 | 750,284 | 12,517,563 |
| 4-person household Map | 305 | 1,154 | 605,447 | 10,998,793 |
| 5-person household Map | 159 | 536 | 268,036 | 5,057,765 |
| 6-person household Map | 60 | 225 | 104,017 | 1,965,796 |
| 7-or-more-person household Map | 35 | 135 | 68,440 | 1,373,983 |
| Renter occupied: Map | 404 | 1,959 | 2,421,823 | 40,730,218 |
| 1-person household Map | 102 | 515 | 794,701 | 14,751,340 |
| 2-person household Map | 94 | 459 | 667,487 | 10,624,023 |
| 3-person household Map | 75 | 367 | 402,402 | 6,240,422 |
| 4-person household Map | 55 | 293 | 294,930 | 4,626,453 |
| 5-person household Map | 47 | 200 | 151,194 | 2,480,866 |
| 6-person household Map | 18 | 79 | 64,378 | 1,108,903 |
| 7-or-more-person household Map | 13 | 46 | 46,731 | 898,211 |
Loading...