


Sharp County, Arkansas
About
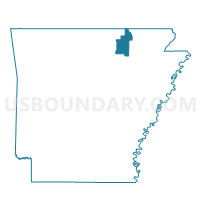
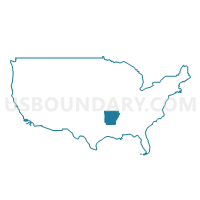
Outline

Summary
| Unique Area Identifier | 120381 |
| Name | Sharp County |
| State | Arkansas |
| Area (square miles) | 606.44 |
| Land Area (square miles) | 604.44 |
| Water Area (square miles) | 2.00 |
| % of Land Area | 99.67 |
| % of Water Area | 0.33 |
| Latitude of the Internal Point | 36.17339890 |
| Longtitude of the Internal Point | -91.47106890 |
| Total Population | 17,264 |
| Total Housing Units | 9,822 |
| Total Households | 7,360 |
| Median Age | 47 |
Maps
Graphs
Select a template below for downloading or customizing gragh for Sharp County, Arkansas


Neighbors
Neighoring County (by Name) Neighboring County on the Map
- Fulton County, AR
- Independence County, AR
- Izard County, AR
- Lawrence County, AR
- Oregon County, MO
- Randolph County, AR
County Subdivision in Sharp County (by Name) Neighboring County Subdivision on the Map
- Big Creek township, Sharp County, AR
- Cave township, Sharp County, AR
- Cherokee township, Sharp County, AR
- Davidson township, Sharp County, AR
- East Sullivan township, Sharp County, AR
- Hardy township, Sharp County, AR
- Highland township, Sharp County, AR
- Jackson township, Sharp County, AR
- Lave Creek township, Sharp County, AR
- Lower North township, Sharp County, AR
- Morgan township, Sharp County, AR
- North Big Rock township, Sharp County, AR
- North Lebanon township, Sharp County, AR
- North Union township, Sharp County, AR
- Ozark township, Sharp County, AR
- Piney Fork township, Sharp County, AR
- Richwoods township, Sharp County, AR
- Scott township, Sharp County, AR
- South Big Rock township, Sharp County, AR
- South Lebanon township, Sharp County, AR
- South Union township, Sharp County, AR
- Strawberry township, Sharp County, AR
- Upper North township, Sharp County, AR
- Washington township, Sharp County, AR
- West Sullivan township, Sharp County, AR
Top 10 Neighboring Place (by Population) Neighboring Place on the Map
- Cherokee Village city, AR (4,671)
- Horseshoe Bend city, AR (2,184)
- Cave City city, AR (1,904)
- Ash Flat city, AR (1,082)
- Highland city, AR (1,045)
- Hardy city, AR (772)
- Ravenden town, AR (470)
- Evening Shade city, AR (432)
- Sidney town, AR (181)
- Williford town, AR (75)
Top 10 Neighboring Unified School District (by Population) Neighboring Unified School District on the Map
- Batesville School District, AR (19,573)
- Highland School District, AR (11,696)
- Cave City School District, AR (8,385)
- Cedar Ridge School District, AR (5,465)
- Melbourne School District, AR (5,339)
- Izard Cty Consolidated Schools, AR (4,831)
- Thayer R-II School District, MO (3,859)
- Hillcrest School District, AR (3,680)
- Twin Rivers School District, AR (3,374)
- Sloan-Hendrix School District, AR (2,972)
Top 10 Neighboring State Legislative District Lower Chamber (by Population) Neighboring State Legislative District Lower Chamber on the Map
- State House District 153, MO (35,762)
- State House District 82, AR (28,911)
- State House District 72, AR (28,138)
- State House District 80, AR (27,905)
- State House District 71, AR (26,638)
- State House District 73, AR (26,277)
Top 10 Neighboring State Legislative District Upper Chamber (by Population) Neighboring State Legislative District Upper Chamber on the Map
- State Senate District 33, MO (184,118)
- State Senate District 12, AR (83,956)
- State Senate District 11, AR (80,865)
- State Senate District 10, AR (80,214)
Top 10 Neighboring 111th Congressional District (by Population) Neighboring 111th Congressional District on the Map
Top 10 Census Tract in Sharp County (by Population) Neighboring Census Tract on the Map
- Census Tract 4704, Sharp County, AR (5,999)
- Census Tract 4702, Sharp County, AR (5,505)
- Census Tract 4703, Sharp County, AR (3,917)
- Census Tract 4701, Sharp County, AR (1,843)
Top 10 Neighboring 5-Digit ZIP Code Tabulation Area (by Population) Neighboring 5-Digit ZIP Code Tabulation Area on the Map
- 72501, AR (25,099)
- 72521, AR (4,814)
- 72529, AR (4,726)
- 65791, MO (4,585)
- 72542, AR (3,826)
- 72554, AR (2,923)
- 72513, AR (2,856)
- 72512, AR (2,234)
- 72532, AR (1,712)
- 72466, AR (1,481)
Data
Demographic, Population, Households, and Housing Units
** Data sources from census 2010 **
Show Data on Map
Download Full List as CSV
Download Quick Sheet as CSV
| Subject | This Area | Arkansas | National |
|---|---|---|---|
| POPULATION | |||
| Total Population Map | 17,264 | 2,915,918 | 308,745,538 |
| POPULATION, HISPANIC OR LATINO ORIGIN | |||
| Not Hispanic or Latino Map | 16,974 | 2,729,868 | 258,267,944 |
| Hispanic or Latino Map | 290 | 186,050 | 50,477,594 |
| POPULATION, RACE | |||
| White alone Map | 16,582 | 2,245,229 | 223,553,265 |
| Black or African American alone Map | 93 | 449,895 | 38,929,319 |
| American Indian and Alaska Native alone Map | 170 | 22,248 | 2,932,248 |
| Asian alone Map | 50 | 36,102 | 14,674,252 |
| Native Hawaiian and Other Pacific Islander alone Map | 2 | 5,863 | 540,013 |
| Some Other Race alone Map | 72 | 99,571 | 19,107,368 |
| Two or More Races Map | 295 | 57,010 | 9,009,073 |
| POPULATION, SEX | |||
| Male Map | 8,532 | 1,431,637 | 151,781,326 |
| Female Map | 8,732 | 1,484,281 | 156,964,212 |
| POPULATION, AGE (18 YEARS) | |||
| 18 years and over Map | 13,547 | 2,204,443 | 234,564,071 |
| Under 18 years | 3,717 | 711,475 | 74,181,467 |
| POPULATION, AGE | |||
| Under 5 years | 924 | 197,689 | 20,201,362 |
| 5 to 9 years | 986 | 196,877 | 20,348,657 |
| 10 to 14 years | 1,103 | 197,559 | 20,677,194 |
| 15 to 17 years | 704 | 119,350 | 12,954,254 |
| 18 and 19 years | 386 | 84,455 | 9,086,089 |
| 20 years | 163 | 42,770 | 4,519,129 |
| 21 years | 137 | 40,770 | 4,354,294 |
| 22 to 24 years | 432 | 116,110 | 12,712,576 |
| 25 to 29 years | 740 | 192,153 | 21,101,849 |
| 30 to 34 years | 777 | 183,739 | 19,962,099 |
| 35 to 39 years | 843 | 183,614 | 20,179,642 |
| 40 to 44 years | 990 | 182,594 | 20,890,964 |
| 45 to 49 years | 1,148 | 205,544 | 22,708,591 |
| 50 to 54 years | 1,206 | 201,722 | 22,298,125 |
| 55 to 59 years | 1,251 | 183,960 | 19,664,805 |
| 60 and 61 years | 543 | 69,489 | 7,113,727 |
| 62 to 64 years | 797 | 97,542 | 9,704,197 |
| 65 and 66 years | 577 | 56,719 | 5,319,902 |
| 67 to 69 years | 732 | 76,648 | 7,115,361 |
| 70 to 74 years | 974 | 101,235 | 9,278,166 |
| 75 to 79 years | 828 | 77,741 | 7,317,795 |
| 80 to 84 years | 591 | 56,236 | 5,743,327 |
| 85 years and over | 432 | 51,402 | 5,493,433 |
| MEDIAN AGE BY SEX | |||
| Both sexes Map | 47.00 | 37.40 | 37.20 |
| Male Map | 45.80 | 36.10 | 35.80 |
| Female Map | 48.20 | 38.70 | 38.50 |
| HOUSEHOLDS | |||
| Total Households Map | 7,360 | 1,147,084 | 116,716,292 |
| HOUSEHOLDS, HOUSEHOLD TYPE | |||
| Family households: Map | 4,992 | 775,811 | 77,538,296 |
| Husband-wife family Map | 3,960 | 568,277 | 56,510,377 |
| Other family: Map | 1,032 | 207,534 | 21,027,919 |
| Male householder, no wife present Map | 309 | 54,211 | 5,777,570 |
| Female householder, no husband present Map | 723 | 153,323 | 15,250,349 |
| Nonfamily households: Map | 2,368 | 371,273 | 39,177,996 |
| Householder living alone Map | 2,079 | 310,792 | 31,204,909 |
| Householder not living alone Map | 289 | 60,481 | 7,973,087 |
| HOUSEHOLDS, HISPANIC OR LATINO ORIGIN OF HOUSEHOLDER | |||
| Not Hispanic or Latino householder: Map | 7,287 | 1,101,427 | 103,254,926 |
| Hispanic or Latino householder: Map | 73 | 45,657 | 13,461,366 |
| HOUSEHOLDS, RACE OF HOUSEHOLDER | |||
| Householder who is White alone | 7,123 | 918,812 | 89,754,352 |
| Householder who is Black or African American alone | 25 | 167,878 | 14,129,983 |
| Householder who is American Indian and Alaska Native alone | 74 | 8,070 | 939,707 |
| Householder who is Asian alone | 8 | 11,287 | 4,632,164 |
| Householder who is Native Hawaiian and Other Pacific Islander alone | 1 | 1,180 | 143,932 |
| Householder who is Some Other Race alone | 18 | 24,566 | 4,916,427 |
| Householder who is Two or More Races | 111 | 15,291 | 2,199,727 |
| HOUSEHOLDS, HOUSEHOLD TYPE BY HOUSEHOLD SIZE | |||
| Family households: Map | 4,992 | 775,811 | 77,538,296 |
| 2-person household Map | 2,778 | 352,616 | 31,882,616 |
| 3-person household Map | 965 | 179,263 | 17,765,829 |
| 4-person household Map | 709 | 140,067 | 15,214,075 |
| 5-person household Map | 336 | 64,607 | 7,411,997 |
| 6-person household Map | 113 | 24,293 | 3,026,278 |
| 7-or-more-person household Map | 91 | 14,965 | 2,237,501 |
| Nonfamily households: Map | 2,368 | 371,273 | 39,177,996 |
| 1-person household Map | 2,079 | 310,792 | 31,204,909 |
| 2-person household Map | 241 | 49,495 | 6,360,012 |
| 3-person household Map | 34 | 7,187 | 992,156 |
| 4-person household Map | 9 | 2,752 | 411,171 |
| 5-person household Map | 1 | 704 | 126,634 |
| 6-person household Map | 1 | 203 | 48,421 |
| 7-or-more-person household Map | 3 | 140 | 34,693 |
| HOUSING UNITS | |||
| Total Housing Units Map | 9,822 | 1,316,299 | 131,704,730 |
| HOUSING UNITS, OCCUPANCY STATUS | |||
| Occupied Map | 7,360 | 1,147,084 | 116,716,292 |
| Vacant Map | 2,462 | 169,215 | 14,988,438 |
| HOUSING UNITS, OCCUPIED, TENURE | |||
| Owned with a mortgage or a loan Map | 3,099 | 469,654 | 52,979,430 |
| Owned free and clear Map | 2,683 | 298,502 | 23,006,644 |
| Renter occupied Map | 1,578 | 378,928 | 40,730,218 |
| HOUSING UNITS, VACANT, VACANCY STATUS | |||
| For rent Map | 275 | 46,443 | 4,137,567 |
| Rented, not occupied Map | 12 | 2,139 | 206,825 |
| For sale only Map | 241 | 18,500 | 1,896,796 |
| Sold, not occupied Map | 56 | 4,995 | 421,032 |
| For seasonal, recreational, or occasional use Map | 1,352 | 38,153 | 4,649,298 |
| For migrant workers Map | 0 | 345 | 24,161 |
| Other vacant Map | 526 | 58,640 | 3,652,759 |
| HOUSING UNITS, OCCUPIED, AVERAGE HOUSEHOLD SIZE BY TENURE | |||
| Total: Map | 2.32 | 2.47 | 2.58 |
| Owner occupied Map | 2.32 | 2.51 | 2.65 |
| Renter occupied Map | 2.32 | 2.40 | 2.44 |
| HOUSING UNITS, OCCUPIED, TENURE BY RACE OF HOUSEHOLDER | |||
| Owner occupied: Map | 5,782 | 768,156 | 75,986,074 |
| Householder who is White alone Map | 5,619 | 660,988 | 63,446,275 |
| Householder who is Black or African American alone Map | 18 | 76,542 | 6,261,464 |
| Householder who is American Indian and Alaska Native alone Map | 55 | 4,697 | 509,588 |
| Householder who is Asian alone Map | 7 | 6,034 | 2,688,861 |
| Householder who is Native Hawaiian and Other Pacific Islander alone Map | 0 | 217 | 61,911 |
| Householder who is Some Other Race alone Map | 8 | 11,471 | 1,975,817 |
| Householder who is Two or More Races Map | 75 | 8,207 | 1,042,158 |
| Renter occupied: Map | 1,578 | 378,928 | 40,730,218 |
| Householder who is White alone Map | 1,504 | 257,824 | 26,308,077 |
| Householder who is Black or African American alone Map | 7 | 91,336 | 7,868,519 |
| Householder who is American Indian and Alaska Native alone Map | 19 | 3,373 | 430,119 |
| Householder who is Asian alone Map | 1 | 5,253 | 1,943,303 |
| Householder who is Native Hawaiian and Other Pacific Islander alone Map | 1 | 963 | 82,021 |
| Householder who is Some Other Race alone Map | 10 | 13,095 | 2,940,610 |
| Householder who is Two or More Races Map | 36 | 7,084 | 1,157,569 |
| HOUSING UNITS, OCCUPIED, TENURE BY HISPANIC OR LATINO ORIGIN OF HOUSEHOLDER | |||
| Owner occupied: Map | 5,782 | 768,156 | 75,986,074 |
| Not Hispanic or Latino householder Map | 5,741 | 746,179 | 69,617,625 |
| Hispanic or Latino householder Map | 41 | 21,977 | 6,368,449 |
| Renter occupied: Map | 1,578 | 378,928 | 40,730,218 |
| Not Hispanic or Latino householder Map | 1,546 | 355,248 | 33,637,301 |
| Hispanic or Latino householder Map | 32 | 23,680 | 7,092,917 |
| HOUSING UNITS, OCCUPIED, TENURE BY HOUSEHOLD SIZE | |||
| Owner occupied: Map | 5,782 | 768,156 | 75,986,074 |
| 1-person household Map | 1,470 | 173,250 | 16,453,569 |
| 2-person household Map | 2,605 | 303,172 | 27,618,605 |
| 3-person household Map | 759 | 125,565 | 12,517,563 |
| 4-person household Map | 553 | 98,808 | 10,998,793 |
| 5-person household Map | 242 | 42,758 | 5,057,765 |
| 6-person household Map | 85 | 15,422 | 1,965,796 |
| 7-or-more-person household Map | 68 | 9,181 | 1,373,983 |
| Renter occupied: Map | 1,578 | 378,928 | 40,730,218 |
| 1-person household Map | 609 | 137,542 | 14,751,340 |
| 2-person household Map | 414 | 98,939 | 10,624,023 |
| 3-person household Map | 240 | 60,885 | 6,240,422 |
| 4-person household Map | 165 | 44,011 | 4,626,453 |
| 5-person household Map | 95 | 22,553 | 2,480,866 |
| 6-person household Map | 29 | 9,074 | 1,108,903 |
| 7-or-more-person household Map | 26 | 5,924 | 898,211 |
Loading...