


Fairfield County, Connecticut
About
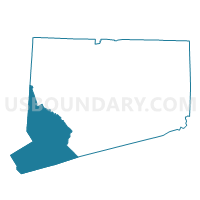
Outline

Summary
| Unique Area Identifier | 120754 |
| Name | Fairfield County |
| State | Connecticut |
| Area (square miles) | 836.92 |
| Land Area (square miles) | 624.89 |
| Water Area (square miles) | 212.03 |
| % of Land Area | 74.67 |
| % of Water Area | 25.33 |
| Latitude of the Internal Point | 41.22810280 |
| Longtitude of the Internal Point | -73.36675740 |
| Total Population | 916,829 |
| Total Housing Units | 361,221 |
| Total Households | 335,545 |
| Median Age | 39.5 |
Maps
Graphs
Select a template below for downloading or customizing gragh for Fairfield County, Connecticut


Neighbors
Neighoring County (by Name) Neighboring County on the Map
- Dutchess County, NY
- Litchfield County, CT
- Nassau County, NY
- New Haven County, CT
- Putnam County, NY
- Suffolk County, NY
- Westchester County, NY
County Subdivision in Fairfield County (by Name) Neighboring County Subdivision on the Map
- Bethel town, Fairfield County, CT
- Bridgeport town, Fairfield County, CT
- Brookfield town, Fairfield County, CT
- County subdivisions not defined, Fairfield County, CT
- Danbury town, Fairfield County, CT
- Darien town, Fairfield County, CT
- Easton town, Fairfield County, CT
- Fairfield town, Fairfield County, CT
- Greenwich town, Fairfield County, CT
- Monroe town, Fairfield County, CT
- New Canaan town, Fairfield County, CT
- New Fairfield town, Fairfield County, CT
- Newtown town, Fairfield County, CT
- Norwalk town, Fairfield County, CT
- Redding town, Fairfield County, CT
- Ridgefield town, Fairfield County, CT
- Shelton town, Fairfield County, CT
- Sherman town, Fairfield County, CT
- Stamford town, Fairfield County, CT
- Stratford town, Fairfield County, CT
- Trumbull town, Fairfield County, CT
- Weston town, Fairfield County, CT
- Westport town, Fairfield County, CT
- Wilton town, Fairfield County, CT
Top 10 Neighboring Place (by Population) Neighboring Place on the Map
- Bridgeport city, CT (144,229)
- Stamford city, CT (122,643)
- Norwalk city, CT (85,603)
- Danbury city, CT (80,893)
- Stratford CDP, CT (51,384)
- Milford city (balance), CT (51,271)
- Shelton city, CT (39,559)
- Trumbull CDP, CT (36,018)
- Port Chester village, NY (28,967)
- Westport CDP, CT (26,391)
Top 10 Neighboring Elementary School District (by Population) Neighboring Elementary School District on the Map
- Orange School District, CT (13,956)
- Redding School District, CT (9,158)
- Easton School District, CT (7,490)
- Sherman School District, CT (3,581)
- Kent School District, CT (2,979)
Top 10 Neighboring Secondary School District (by Population) Neighboring Secondary School District on the Map
- Regional High School District 05, CT (28,509)
- Regional High School District 09, CT (16,648)
- Regional High School District 01, CT (15,471)
Top 10 Neighboring Unified School District (by Population) Neighboring Unified School District on the Map
- Bridgeport School District, CT (144,229)
- Stamford School District, CT (122,643)
- Norwalk School District, CT (85,603)
- Danbury School District, CT (80,893)
- Greenwich School District, CT (61,171)
- Fairfield School District, CT (59,404)
- Smithtown Central School District, NY (57,142)
- Milford School District, CT (52,759)
- Stratford School District, CT (51,384)
- Three Village Central School District, NY (48,424)
Top 10 Neighboring State Legislative District Lower Chamber (by Population) Neighboring State Legislative District Lower Chamber on the Map
- Assembly District 4, NY (137,024)
- Assembly District 99, NY (134,814)
- Assembly District 103, NY (134,686)
- Assembly District 7, NY (134,480)
- Assembly District 13, NY (131,694)
- Assembly District 9, NY (130,285)
- Assembly District 89, NY (129,296)
- Assembly District 91, NY (128,861)
- State House District 146, CT (25,985)
- State House District 131, CT (25,985)
Top 10 Neighboring State Legislative District Upper Chamber (by Population) Neighboring State Legislative District Upper Chamber on the Map
- State Senate District 1, NY (341,254)
- State Senate District 37, NY (326,645)
- State Senate District 5, NY (316,844)
- State Senate District 40, NY (316,324)
- State Senate District 2, NY (314,159)
- State Senate District 24, CT (104,062)
- State Senate District 27, CT (103,721)
- State Senate District 28, CT (103,194)
- State Senate District 30, CT (102,325)
- State Senate District 26, CT (102,047)
Top 10 Neighboring 111th Congressional District (by Population) Neighboring 111th Congressional District on the Map
- Congressional District 5, CT (714,296)
- Congressional District 3, CT (712,339)
- Congressional District 4, CT (706,740)
- Congressional District 1, NY (705,559)
- Congressional District 19, NY (699,959)
- Congressional District 2, NY (679,893)
- Congressional District 18, NY (674,825)
- Congressional District 3, NY (645,508)
Top 10 Census Tract in Fairfield County (by Population) Neighboring Census Tract on the Map
- Census Tract 2104, Fairfield County, CT (8,419)
- Census Tract 503, Fairfield County, CT (8,122)
- Census Tract 1106, Fairfield County, CT (8,085)
- Census Tract 902, Fairfield County, CT (7,831)
- Census Tract 607, Fairfield County, CT (7,675)
- Census Tract 438, Fairfield County, CT (7,650)
- Census Tract 726, Fairfield County, CT (7,583)
- Census Tract 351, Fairfield County, CT (7,406)
- Census Tract 217, Fairfield County, CT (7,354)
- Census Tract 203, Fairfield County, CT (7,263)
Top 10 Neighboring 5-Digit ZIP Code Tabulation Area (by Population) Neighboring 5-Digit ZIP Code Tabulation Area on the Map
- 06902, CT (63,406)
- 06810, CT (49,482)
- 06606, CT (46,236)
- 06484, CT (39,559)
- 10573, NY (38,352)
- 06460, CT (38,207)
- 06611, CT (36,091)
- 06824, CT (33,900)
- 06614, CT (32,929)
- 06811, CT (31,400)
Data
Demographic, Population, Households, and Housing Units
** Data sources from census 2010 **
Show Data on Map
Download Full List as CSV
Download Quick Sheet as CSV
| Subject | This Area | Connecticut | National |
|---|---|---|---|
| POPULATION | |||
| Total Population Map | 916,829 | 3,574,097 | 308,745,538 |
| POPULATION, HISPANIC OR LATINO ORIGIN | |||
| Not Hispanic or Latino Map | 761,804 | 3,095,010 | 258,267,944 |
| Hispanic or Latino Map | 155,025 | 479,087 | 50,477,594 |
| POPULATION, RACE | |||
| White alone Map | 685,900 | 2,772,410 | 223,553,265 |
| Black or African American alone Map | 99,317 | 362,296 | 38,929,319 |
| American Indian and Alaska Native alone Map | 2,384 | 11,256 | 2,932,248 |
| Asian alone Map | 42,284 | 135,565 | 14,674,252 |
| Native Hawaiian and Other Pacific Islander alone Map | 442 | 1,428 | 540,013 |
| Some Other Race alone Map | 62,474 | 198,466 | 19,107,368 |
| Two or More Races Map | 24,028 | 92,676 | 9,009,073 |
| POPULATION, SEX | |||
| Male Map | 445,601 | 1,739,614 | 151,781,326 |
| Female Map | 471,228 | 1,834,483 | 156,964,212 |
| POPULATION, AGE (18 YEARS) | |||
| 18 years and over Map | 689,810 | 2,757,082 | 234,564,071 |
| Under 18 years | 227,019 | 817,015 | 74,181,467 |
| POPULATION, AGE | |||
| Under 5 years | 56,899 | 202,106 | 20,201,362 |
| 5 to 9 years | 62,907 | 222,571 | 20,348,657 |
| 10 to 14 years | 66,606 | 240,265 | 20,677,194 |
| 15 to 17 years | 40,607 | 152,073 | 12,954,254 |
| 18 and 19 years | 21,585 | 98,761 | 9,086,089 |
| 20 years | 10,023 | 48,139 | 4,519,129 |
| 21 years | 9,580 | 46,335 | 4,354,294 |
| 22 to 24 years | 30,913 | 133,424 | 12,712,576 |
| 25 to 29 years | 52,251 | 214,145 | 21,101,849 |
| 30 to 34 years | 53,812 | 206,232 | 19,962,099 |
| 35 to 39 years | 60,121 | 222,401 | 20,179,642 |
| 40 to 44 years | 71,125 | 262,037 | 20,890,964 |
| 45 to 49 years | 77,362 | 291,272 | 22,708,591 |
| 50 to 54 years | 71,924 | 284,325 | 22,298,125 |
| 55 to 59 years | 58,614 | 240,157 | 19,664,805 |
| 60 and 61 years | 19,951 | 84,356 | 7,113,727 |
| 62 to 64 years | 28,474 | 118,939 | 9,704,197 |
| 65 and 66 years | 15,593 | 64,434 | 5,319,902 |
| 67 to 69 years | 20,712 | 84,847 | 7,115,361 |
| 70 to 74 years | 26,036 | 105,663 | 9,278,166 |
| 75 to 79 years | 22,147 | 89,252 | 7,317,795 |
| 80 to 84 years | 19,125 | 77,465 | 5,743,327 |
| 85 years and over | 20,462 | 84,898 | 5,493,433 |
| MEDIAN AGE BY SEX | |||
| Both sexes Map | 39.50 | 40.00 | 37.20 |
| Male Map | 38.00 | 38.50 | 35.80 |
| Female Map | 40.80 | 41.30 | 38.50 |
| HOUSEHOLDS | |||
| Total Households Map | 335,545 | 1,371,087 | 116,716,292 |
| HOUSEHOLDS, HOUSEHOLD TYPE | |||
| Family households: Map | 232,896 | 908,661 | 77,538,296 |
| Husband-wife family Map | 178,028 | 672,013 | 56,510,377 |
| Other family: Map | 54,868 | 236,648 | 21,027,919 |
| Male householder, no wife present Map | 13,748 | 59,675 | 5,777,570 |
| Female householder, no husband present Map | 41,120 | 176,973 | 15,250,349 |
| Nonfamily households: Map | 102,649 | 462,426 | 39,177,996 |
| Householder living alone Map | 83,493 | 373,648 | 31,204,909 |
| Householder not living alone Map | 19,156 | 88,778 | 7,973,087 |
| HOUSEHOLDS, HISPANIC OR LATINO ORIGIN OF HOUSEHOLDER | |||
| Not Hispanic or Latino householder: Map | 292,714 | 1,234,310 | 103,254,926 |
| Hispanic or Latino householder: Map | 42,831 | 136,777 | 13,461,366 |
| HOUSEHOLDS, RACE OF HOUSEHOLDER | |||
| Householder who is White alone | 264,450 | 1,118,798 | 89,754,352 |
| Householder who is Black or African American alone | 34,335 | 126,729 | 14,129,983 |
| Householder who is American Indian and Alaska Native alone | 687 | 3,856 | 939,707 |
| Householder who is Asian alone | 13,229 | 41,812 | 4,632,164 |
| Householder who is Native Hawaiian and Other Pacific Islander alone | 96 | 406 | 143,932 |
| Householder who is Some Other Race alone | 17,073 | 57,489 | 4,916,427 |
| Householder who is Two or More Races | 5,675 | 21,997 | 2,199,727 |
| HOUSEHOLDS, HOUSEHOLD TYPE BY HOUSEHOLD SIZE | |||
| Family households: Map | 232,896 | 908,661 | 77,538,296 |
| 2-person household Map | 85,494 | 369,216 | 31,882,616 |
| 3-person household Map | 54,697 | 217,411 | 17,765,829 |
| 4-person household Map | 53,502 | 193,491 | 15,214,075 |
| 5-person household Map | 25,172 | 83,677 | 7,411,997 |
| 6-person household Map | 8,902 | 28,907 | 3,026,278 |
| 7-or-more-person household Map | 5,129 | 15,959 | 2,237,501 |
| Nonfamily households: Map | 102,649 | 462,426 | 39,177,996 |
| 1-person household Map | 83,493 | 373,648 | 31,204,909 |
| 2-person household Map | 15,167 | 73,879 | 6,360,012 |
| 3-person household Map | 2,230 | 9,247 | 992,156 |
| 4-person household Map | 994 | 3,625 | 411,171 |
| 5-person household Map | 437 | 1,239 | 126,634 |
| 6-person household Map | 186 | 441 | 48,421 |
| 7-or-more-person household Map | 142 | 347 | 34,693 |
| HOUSING UNITS | |||
| Total Housing Units Map | 361,221 | 1,487,891 | 131,704,730 |
| HOUSING UNITS, OCCUPANCY STATUS | |||
| Occupied Map | 335,545 | 1,371,087 | 116,716,292 |
| Vacant Map | 25,676 | 116,804 | 14,988,438 |
| HOUSING UNITS, OCCUPIED, TENURE | |||
| Owned with a mortgage or a loan Map | 171,695 | 680,960 | 52,979,430 |
| Owned free and clear Map | 58,472 | 244,326 | 23,006,644 |
| Renter occupied Map | 105,378 | 445,801 | 40,730,218 |
| HOUSING UNITS, VACANT, VACANCY STATUS | |||
| For rent Map | 8,956 | 40,004 | 4,137,567 |
| Rented, not occupied Map | 520 | 1,960 | 206,825 |
| For sale only Map | 4,023 | 15,564 | 1,896,796 |
| Sold, not occupied Map | 978 | 3,729 | 421,032 |
| For seasonal, recreational, or occasional use Map | 5,433 | 29,618 | 4,649,298 |
| For migrant workers Map | 18 | 55 | 24,161 |
| Other vacant Map | 5,748 | 25,874 | 3,652,759 |
| HOUSING UNITS, OCCUPIED, AVERAGE HOUSEHOLD SIZE BY TENURE | |||
| Total: Map | 2.68 | 2.52 | 2.58 |
| Owner occupied Map | 2.77 | 2.64 | 2.65 |
| Renter occupied Map | 2.46 | 2.27 | 2.44 |
| HOUSING UNITS, OCCUPIED, TENURE BY RACE OF HOUSEHOLDER | |||
| Owner occupied: Map | 230,167 | 925,286 | 75,986,074 |
| Householder who is White alone Map | 200,522 | 825,201 | 63,446,275 |
| Householder who is Black or African American alone Map | 14,279 | 50,482 | 6,261,464 |
| Householder who is American Indian and Alaska Native alone Map | 273 | 1,726 | 509,588 |
| Householder who is Asian alone Map | 7,880 | 23,507 | 2,688,861 |
| Householder who is Native Hawaiian and Other Pacific Islander alone Map | 41 | 172 | 61,911 |
| Householder who is Some Other Race alone Map | 4,717 | 14,728 | 1,975,817 |
| Householder who is Two or More Races Map | 2,455 | 9,470 | 1,042,158 |
| Renter occupied: Map | 105,378 | 445,801 | 40,730,218 |
| Householder who is White alone Map | 63,928 | 293,597 | 26,308,077 |
| Householder who is Black or African American alone Map | 20,056 | 76,247 | 7,868,519 |
| Householder who is American Indian and Alaska Native alone Map | 414 | 2,130 | 430,119 |
| Householder who is Asian alone Map | 5,349 | 18,305 | 1,943,303 |
| Householder who is Native Hawaiian and Other Pacific Islander alone Map | 55 | 234 | 82,021 |
| Householder who is Some Other Race alone Map | 12,356 | 42,761 | 2,940,610 |
| Householder who is Two or More Races Map | 3,220 | 12,527 | 1,157,569 |
| HOUSING UNITS, OCCUPIED, TENURE BY HISPANIC OR LATINO ORIGIN OF HOUSEHOLDER | |||
| Owner occupied: Map | 230,167 | 925,286 | 75,986,074 |
| Not Hispanic or Latino householder Map | 214,365 | 879,820 | 69,617,625 |
| Hispanic or Latino householder Map | 15,802 | 45,466 | 6,368,449 |
| Renter occupied: Map | 105,378 | 445,801 | 40,730,218 |
| Not Hispanic or Latino householder Map | 78,349 | 354,490 | 33,637,301 |
| Hispanic or Latino householder Map | 27,029 | 91,311 | 7,092,917 |
| HOUSING UNITS, OCCUPIED, TENURE BY HOUSEHOLD SIZE | |||
| Owner occupied: Map | 230,167 | 925,286 | 75,986,074 |
| 1-person household Map | 46,013 | 195,555 | 16,453,569 |
| 2-person household Map | 74,089 | 325,808 | 27,618,605 |
| 3-person household Map | 39,970 | 160,024 | 12,517,563 |
| 4-person household Map | 41,633 | 150,836 | 10,998,793 |
| 5-person household Map | 19,074 | 62,773 | 5,057,765 |
| 6-person household Map | 6,268 | 20,237 | 1,965,796 |
| 7-or-more-person household Map | 3,120 | 10,053 | 1,373,983 |
| Renter occupied: Map | 105,378 | 445,801 | 40,730,218 |
| 1-person household Map | 37,480 | 178,093 | 14,751,340 |
| 2-person household Map | 26,572 | 117,287 | 10,624,023 |
| 3-person household Map | 16,957 | 66,634 | 6,240,422 |
| 4-person household Map | 12,863 | 46,280 | 4,626,453 |
| 5-person household Map | 6,535 | 22,143 | 2,480,866 |
| 6-person household Map | 2,820 | 9,111 | 1,108,903 |
| 7-or-more-person household Map | 2,151 | 6,253 | 898,211 |
Loading...