


Lancaster County, Pennsylvania
About
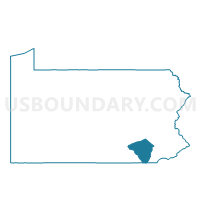
Outline

Summary
| Unique Area Identifier | 119477 |
| Name | Lancaster County |
| State | Pennsylvania |
| Area (square miles) | 983.80 |
| Land Area (square miles) | 943.81 |
| Water Area (square miles) | 39.99 |
| % of Land Area | 95.93 |
| % of Water Area | 4.07 |
| Latitude of the Internal Point | 40.04199210 |
| Longtitude of the Internal Point | -76.25019800 |
| Total Population | 519,445 |
| Total Housing Units | 202,952 |
| Total Households | 193,602 |
| Median Age | 38.2 |
Maps

Graphs
Select a template below for downloading or customizing gragh for Lancaster County, Pennsylvania


Neighbors
Neighoring County (by Name) Neighboring County on the Map
- Berks County, PA
- Cecil County, MD
- Chester County, PA
- Dauphin County, PA
- Harford County, MD
- Lebanon County, PA
- York County, PA
County Subdivision in Lancaster County (by Name) Neighboring County Subdivision on the Map
- Adamstown borough, Lancaster County, PA
- Akron borough, Lancaster County, PA
- Bart township, Lancaster County, PA
- Brecknock township, Lancaster County, PA
- Caernarvon township, Lancaster County, PA
- Christiana borough, Lancaster County, PA
- Clay township, Lancaster County, PA
- Colerain township, Lancaster County, PA
- Columbia borough, Lancaster County, PA
- Conestoga township, Lancaster County, PA
- Conoy township, Lancaster County, PA
- Denver borough, Lancaster County, PA
- Drumore township, Lancaster County, PA
- Earl township, Lancaster County, PA
- East Cocalico township, Lancaster County, PA
- East Donegal township, Lancaster County, PA
- East Drumore township, Lancaster County, PA
- East Earl township, Lancaster County, PA
- East Hempfield township, Lancaster County, PA
- East Lampeter township, Lancaster County, PA
- East Petersburg borough, Lancaster County, PA
- Eden township, Lancaster County, PA
- Elizabeth township, Lancaster County, PA
- Elizabethtown borough, Lancaster County, PA
- Ephrata borough, Lancaster County, PA
- Ephrata township, Lancaster County, PA
- Fulton township, Lancaster County, PA
- Lancaster city, Lancaster County, PA
- Lancaster township, Lancaster County, PA
- Leacock township, Lancaster County, PA
- Lititz borough, Lancaster County, PA
- Little Britain township, Lancaster County, PA
- Manheim borough, Lancaster County, PA
- Manheim township, Lancaster County, PA
- Manor township, Lancaster County, PA
- Marietta borough, Lancaster County, PA
- Martic township, Lancaster County, PA
- Millersville borough, Lancaster County, PA
- Mount Joy borough, Lancaster County, PA
- Mount Joy township, Lancaster County, PA
- Mountville borough, Lancaster County, PA
- New Holland borough, Lancaster County, PA
- Paradise township, Lancaster County, PA
- Penn township, Lancaster County, PA
- Pequea township, Lancaster County, PA
- Providence township, Lancaster County, PA
- Quarryville borough, Lancaster County, PA
- Rapho township, Lancaster County, PA
- Sadsbury township, Lancaster County, PA
- Salisbury township, Lancaster County, PA
- Strasburg borough, Lancaster County, PA
- Strasburg township, Lancaster County, PA
- Terre Hill borough, Lancaster County, PA
- Upper Leacock township, Lancaster County, PA
- Warwick township, Lancaster County, PA
- West Cocalico township, Lancaster County, PA
- West Donegal township, Lancaster County, PA
- West Earl township, Lancaster County, PA
- West Hempfield township, Lancaster County, PA
- West Lampeter township, Lancaster County, PA
Top 10 Neighboring Place (by Population) Neighboring Place on the Map
- Lancaster city, PA (59,322)
- Ephrata borough, PA (13,394)
- Elizabethtown borough, PA (11,545)
- Columbia borough, PA (10,400)
- Lititz borough, PA (9,369)
- Millersville borough, PA (8,168)
- Willow Street CDP, PA (7,578)
- Mount Joy borough, PA (7,410)
- Leola CDP, PA (7,214)
- New Holland borough, PA (5,378)
Top 10 Neighboring Unified School District (by Population) Neighboring Unified School District on the Map
- Harford County Public Schools, MD (244,826)
- Cecil County Public Schools, MD (101,108)
- Lancaster School District, PA (74,885)
- Coatesville Area School District, PA (62,979)
- Hempfield School District, PA (46,983)
- Penn Manor School District, PA (41,319)
- Wilson School District, PA (38,983)
- Red Lion Area School District, PA (38,264)
- Manheim Township School District, PA (38,162)
- Cornwall-Lebanon School District, PA (34,729)
Top 10 Neighboring State Legislative District Lower Chamber (by Population) Neighboring State Legislative District Lower Chamber on the Map
- State Legislative Subdistrict 35A, MD (84,725)
- State House District 13, PA (77,777)
- State House District 47, PA (75,494)
- State House District 26, PA (74,084)
- State House District 92, PA (68,932)
- State House District 94, PA (68,912)
- State House District 43, PA (68,386)
- State House District 102, PA (68,288)
- State House District 129, PA (68,094)
- State House District 128, PA (67,410)
Top 10 Neighboring State Legislative District Upper Chamber (by Population) Neighboring State Legislative District Upper Chamber on the Map
- State Senate District 44, PA (288,673)
- State Senate District 28, PA (284,462)
- State Senate District 48, PA (278,934)
- State Senate District 9, PA (277,401)
- State Senate District 36, PA (275,192)
- State Senate District 13, PA (272,163)
- State Senate District 15, PA (266,253)
- State Senate District 34, MD (131,492)
- State Senate District 35, MD (128,326)
- State Senate Districts not defined (Cecil County), MD (0)
Top 10 Neighboring 111th Congressional District (by Population) Neighboring 111th Congressional District on the Map
- Congressional District 1, MD (744,275)
- Congressional District 6, MD (738,943)
- Congressional District 19, PA (728,630)
- Congressional District 6, PA (726,465)
- Congressional District 16, PA (723,977)
- Congressional District 17, PA (681,835)
Top 10 Census Tract in Lancaster County (by Population) Neighboring Census Tract on the Map
- Census Tract 106, Lancaster County, PA (9,853)
- Census Tract 137.02, Lancaster County, PA (9,175)
- Census Tract 103, Lancaster County, PA (8,789)
- Census Tract 135.01, Lancaster County, PA (8,695)
- Census Tract 108.01, Lancaster County, PA (8,260)
- Census Tract 118.04, Lancaster County, PA (8,211)
- Census Tract 130, Lancaster County, PA (7,868)
- Census Tract 127, Lancaster County, PA (7,802)
- Census Tract 111, Lancaster County, PA (7,755)
- Census Tract 146.02, Lancaster County, PA (7,741)
Top 10 Neighboring 5-Digit ZIP Code Tabulation Area (by Population) Neighboring 5-Digit ZIP Code Tabulation Area on the Map
- 17603, PA (61,973)
- 17602, PA (52,452)
- 17601, PA (49,779)
- 17543, PA (42,626)
- 17042, PA (37,133)
- 17522, PA (32,483)
- 17022, PA (29,602)
- 19608, PA (22,719)
- 17406, PA (22,156)
- 17057, PA (21,329)
Data
Demographic, Population, Households, and Housing Units
** Data sources from census 2010 **
Show Data on Map
Download Full List as CSV
Download Quick Sheet as CSV
| Subject | This Area | Pennsylvania | National |
|---|---|---|---|
| POPULATION | |||
| Total Population Map | 519,445 | 12,702,379 | 308,745,538 |
| POPULATION, HISPANIC OR LATINO ORIGIN | |||
| Not Hispanic or Latino Map | 474,515 | 11,982,719 | 258,267,944 |
| Hispanic or Latino Map | 44,930 | 719,660 | 50,477,594 |
| POPULATION, RACE | |||
| White alone Map | 460,171 | 10,406,288 | 223,553,265 |
| Black or African American alone Map | 19,035 | 1,377,689 | 38,929,319 |
| American Indian and Alaska Native alone Map | 1,195 | 26,843 | 2,932,248 |
| Asian alone Map | 9,860 | 349,088 | 14,674,252 |
| Native Hawaiian and Other Pacific Islander alone Map | 164 | 3,653 | 540,013 |
| Some Other Race alone Map | 18,819 | 300,983 | 19,107,368 |
| Two or More Races Map | 10,201 | 237,835 | 9,009,073 |
| POPULATION, SEX | |||
| Male Map | 253,836 | 6,190,363 | 151,781,326 |
| Female Map | 265,609 | 6,512,016 | 156,964,212 |
| POPULATION, AGE (18 YEARS) | |||
| 18 years and over Map | 390,430 | 9,910,224 | 234,564,071 |
| Under 18 years | 129,015 | 2,792,155 | 74,181,467 |
| POPULATION, AGE | |||
| Under 5 years | 35,521 | 729,538 | 20,201,362 |
| 5 to 9 years | 35,446 | 753,635 | 20,348,657 |
| 10 to 14 years | 35,553 | 791,151 | 20,677,194 |
| 15 to 17 years | 22,495 | 517,831 | 12,954,254 |
| 18 and 19 years | 15,605 | 387,235 | 9,086,089 |
| 20 years | 7,656 | 191,942 | 4,519,129 |
| 21 years | 7,458 | 183,257 | 4,354,294 |
| 22 to 24 years | 19,919 | 498,947 | 12,712,576 |
| 25 to 29 years | 31,497 | 781,527 | 21,101,849 |
| 30 to 34 years | 29,493 | 729,592 | 19,962,099 |
| 35 to 39 years | 30,862 | 764,287 | 20,179,642 |
| 40 to 44 years | 32,767 | 851,382 | 20,890,964 |
| 45 to 49 years | 37,721 | 955,763 | 22,708,591 |
| 50 to 54 years | 37,680 | 984,641 | 22,298,125 |
| 55 to 59 years | 33,534 | 879,048 | 19,664,805 |
| 60 and 61 years | 11,812 | 312,575 | 7,113,727 |
| 62 to 64 years | 16,646 | 430,721 | 9,704,197 |
| 65 and 66 years | 9,191 | 231,623 | 5,319,902 |
| 67 to 69 years | 12,365 | 321,379 | 7,115,361 |
| 70 to 74 years | 16,684 | 426,536 | 9,278,166 |
| 75 to 79 years | 14,521 | 362,332 | 7,317,795 |
| 80 to 84 years | 12,173 | 311,761 | 5,743,327 |
| 85 years and over | 12,846 | 305,676 | 5,493,433 |
| MEDIAN AGE BY SEX | |||
| Both sexes Map | 38.20 | 40.10 | 37.20 |
| Male Map | 36.80 | 38.70 | 35.80 |
| Female Map | 39.50 | 41.50 | 38.50 |
| HOUSEHOLDS | |||
| Total Households Map | 193,602 | 5,018,904 | 116,716,292 |
| HOUSEHOLDS, HOUSEHOLD TYPE | |||
| Family households: Map | 135,401 | 3,261,307 | 77,538,296 |
| Husband-wife family Map | 109,118 | 2,417,765 | 56,510,377 |
| Other family: Map | 26,283 | 843,542 | 21,027,919 |
| Male householder, no wife present Map | 7,670 | 229,495 | 5,777,570 |
| Female householder, no husband present Map | 18,613 | 614,047 | 15,250,349 |
| Nonfamily households: Map | 58,201 | 1,757,597 | 39,177,996 |
| Householder living alone Map | 46,793 | 1,433,415 | 31,204,909 |
| Householder not living alone Map | 11,408 | 324,182 | 7,973,087 |
| HOUSEHOLDS, HISPANIC OR LATINO ORIGIN OF HOUSEHOLDER | |||
| Not Hispanic or Latino householder: Map | 180,828 | 4,823,358 | 103,254,926 |
| Hispanic or Latino householder: Map | 12,774 | 195,546 | 13,461,366 |
| HOUSEHOLDS, RACE OF HOUSEHOLDER | |||
| Householder who is White alone | 176,534 | 4,264,337 | 89,754,352 |
| Householder who is Black or African American alone | 6,224 | 498,966 | 14,129,983 |
| Householder who is American Indian and Alaska Native alone | 380 | 9,573 | 939,707 |
| Householder who is Asian alone | 2,696 | 109,060 | 4,632,164 |
| Householder who is Native Hawaiian and Other Pacific Islander alone | 41 | 1,127 | 143,932 |
| Householder who is Some Other Race alone | 5,712 | 82,237 | 4,916,427 |
| Householder who is Two or More Races | 2,015 | 53,604 | 2,199,727 |
| HOUSEHOLDS, HOUSEHOLD TYPE BY HOUSEHOLD SIZE | |||
| Family households: Map | 135,401 | 3,261,307 | 77,538,296 |
| 2-person household Map | 60,107 | 1,442,819 | 31,882,616 |
| 3-person household Map | 29,018 | 767,169 | 17,765,829 |
| 4-person household Map | 24,935 | 620,755 | 15,214,075 |
| 5-person household Map | 11,642 | 271,611 | 7,411,997 |
| 6-person household Map | 4,929 | 98,268 | 3,026,278 |
| 7-or-more-person household Map | 4,770 | 60,685 | 2,237,501 |
| Nonfamily households: Map | 58,201 | 1,757,597 | 39,177,996 |
| 1-person household Map | 46,793 | 1,433,415 | 31,204,909 |
| 2-person household Map | 9,130 | 262,684 | 6,360,012 |
| 3-person household Map | 1,573 | 36,955 | 992,156 |
| 4-person household Map | 515 | 16,687 | 411,171 |
| 5-person household Map | 101 | 4,799 | 126,634 |
| 6-person household Map | 50 | 1,720 | 48,421 |
| 7-or-more-person household Map | 39 | 1,337 | 34,693 |
| HOUSING UNITS | |||
| Total Housing Units Map | 202,952 | 5,567,315 | 131,704,730 |
| HOUSING UNITS, OCCUPANCY STATUS | |||
| Occupied Map | 193,602 | 5,018,904 | 116,716,292 |
| Vacant Map | 9,350 | 548,411 | 14,988,438 |
| HOUSING UNITS, OCCUPIED, TENURE | |||
| Owned with a mortgage or a loan Map | 89,572 | 2,268,674 | 52,979,430 |
| Owned free and clear Map | 43,131 | 1,223,048 | 23,006,644 |
| Renter occupied Map | 60,899 | 1,527,182 | 40,730,218 |
| HOUSING UNITS, VACANT, VACANCY STATUS | |||
| For rent Map | 3,411 | 135,262 | 4,137,567 |
| Rented, not occupied Map | 300 | 9,386 | 206,825 |
| For sale only Map | 1,953 | 64,818 | 1,896,796 |
| Sold, not occupied Map | 531 | 20,131 | 421,032 |
| For seasonal, recreational, or occasional use Map | 930 | 161,582 | 4,649,298 |
| For migrant workers Map | 11 | 411 | 24,161 |
| Other vacant Map | 2,214 | 156,821 | 3,652,759 |
| HOUSING UNITS, OCCUPIED, AVERAGE HOUSEHOLD SIZE BY TENURE | |||
| Total: Map | 2.62 | 2.45 | 2.58 |
| Owner occupied Map | 2.75 | 2.57 | 2.65 |
| Renter occupied Map | 2.34 | 2.16 | 2.44 |
| HOUSING UNITS, OCCUPIED, TENURE BY RACE OF HOUSEHOLDER | |||
| Owner occupied: Map | 132,703 | 3,491,722 | 75,986,074 |
| Householder who is White alone Map | 126,000 | 3,140,005 | 63,446,275 |
| Householder who is Black or African American alone Map | 2,170 | 228,851 | 6,261,464 |
| Householder who is American Indian and Alaska Native alone Map | 178 | 4,562 | 509,588 |
| Householder who is Asian alone Map | 1,848 | 62,204 | 2,688,861 |
| Householder who is Native Hawaiian and Other Pacific Islander alone Map | 14 | 544 | 61,911 |
| Householder who is Some Other Race alone Map | 1,668 | 30,761 | 1,975,817 |
| Householder who is Two or More Races Map | 825 | 24,795 | 1,042,158 |
| Renter occupied: Map | 60,899 | 1,527,182 | 40,730,218 |
| Householder who is White alone Map | 50,534 | 1,124,332 | 26,308,077 |
| Householder who is Black or African American alone Map | 4,054 | 270,115 | 7,868,519 |
| Householder who is American Indian and Alaska Native alone Map | 202 | 5,011 | 430,119 |
| Householder who is Asian alone Map | 848 | 46,856 | 1,943,303 |
| Householder who is Native Hawaiian and Other Pacific Islander alone Map | 27 | 583 | 82,021 |
| Householder who is Some Other Race alone Map | 4,044 | 51,476 | 2,940,610 |
| Householder who is Two or More Races Map | 1,190 | 28,809 | 1,157,569 |
| HOUSING UNITS, OCCUPIED, TENURE BY HISPANIC OR LATINO ORIGIN OF HOUSEHOLDER | |||
| Owner occupied: Map | 132,703 | 3,491,722 | 75,986,074 |
| Not Hispanic or Latino householder Map | 128,367 | 3,408,824 | 69,617,625 |
| Hispanic or Latino householder Map | 4,336 | 82,898 | 6,368,449 |
| Renter occupied: Map | 60,899 | 1,527,182 | 40,730,218 |
| Not Hispanic or Latino householder Map | 52,461 | 1,414,534 | 33,637,301 |
| Hispanic or Latino householder Map | 8,438 | 112,648 | 7,092,917 |
| HOUSING UNITS, OCCUPIED, TENURE BY HOUSEHOLD SIZE | |||
| Owner occupied: Map | 132,703 | 3,491,722 | 75,986,074 |
| 1-person household Map | 23,568 | 767,169 | 16,453,569 |
| 2-person household Map | 52,325 | 1,304,206 | 27,618,605 |
| 3-person household Map | 21,796 | 596,731 | 12,517,563 |
| 4-person household Map | 19,350 | 499,363 | 10,998,793 |
| 5-person household Map | 8,590 | 210,370 | 5,057,765 |
| 6-person household Map | 3,516 | 72,113 | 1,965,796 |
| 7-or-more-person household Map | 3,558 | 41,770 | 1,373,983 |
| Renter occupied: Map | 60,899 | 1,527,182 | 40,730,218 |
| 1-person household Map | 23,225 | 666,246 | 14,751,340 |
| 2-person household Map | 16,912 | 401,297 | 10,624,023 |
| 3-person household Map | 8,795 | 207,393 | 6,240,422 |
| 4-person household Map | 6,100 | 138,079 | 4,626,453 |
| 5-person household Map | 3,153 | 66,040 | 2,480,866 |
| 6-person household Map | 1,463 | 27,875 | 1,108,903 |
| 7-or-more-person household Map | 1,251 | 20,252 | 898,211 |
Loading...