


York County, South Carolina
About
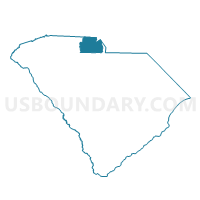
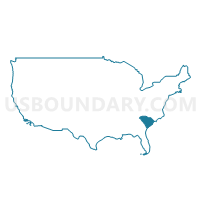
Outline

Summary
| Unique Area Identifier | 121349 |
| Name | York County |
| State | South Carolina |
| Area (square miles) | 695.81 |
| Land Area (square miles) | 680.59 |
| Water Area (square miles) | 15.21 |
| % of Land Area | 97.81 |
| % of Water Area | 2.19 |
| Latitude of the Internal Point | 34.97019040 |
| Longtitude of the Internal Point | -81.18318850 |
| Total Population | 226,073 |
| Total Housing Units | 94,196 |
| Total Households | 85,864 |
| Median Age | 37.2 |
Maps
Graphs
Select a template below for downloading or customizing gragh for York County, South Carolina


Neighbors
Neighoring County (by Name) Neighboring County on the Map
- Cherokee County, SC
- Chester County, SC
- Cleveland County, NC
- Gaston County, NC
- Lancaster County, SC
- Mecklenburg County, NC
- Union County, SC
County Subdivision in York County (by Name) Neighboring County Subdivision on the Map
- Clover CCD, York County, SC
- Fort Mill CCD, York County, SC
- Hickory Grove CCD, York County, SC
- McConnells CCD, York County, SC
- Rock Hill CCD, York County, SC
- York CCD, York County, SC
Top 10 Neighboring Place (by Population) Neighboring Place on the Map
- Charlotte city, NC (731,424)
- Rock Hill city, SC (66,154)
- Fort Mill town, SC (10,811)
- Lake Wylie CDP, SC (8,841)
- York city, SC (7,736)
- Tega Cay city, SC (7,620)
- Pineville town, NC (7,479)
- Clover town, SC (5,094)
- Newport CDP, SC (4,136)
- India Hook CDP, SC (3,328)
Top 10 Neighboring Unified School District (by Population) Neighboring Unified School District on the Map
- Charlotte-Mecklenburg Schools, NC (919,628)
- Gaston County Schools, NC (206,086)
- York School District 3, SC (110,728)
- Cleveland County Schools, NC (98,078)
- Lancaster County School District, SC (76,652)
- Cherokee County School District, SC (53,383)
- York School District 4, SC (49,865)
- York School District 2, SC (34,368)
- Chester County School District, SC (33,140)
- York School District 1, SC (31,112)
Top 10 Neighboring State Legislative District Lower Chamber (by Population) Neighboring State Legislative District Lower Chamber on the Map
- State House District 107, NC (93,460)
- State House District 109, NC (73,605)
- State House District 111, NC (68,632)
- State House District 48, SC (63,391)
- State House District 45, SC (50,117)
- State House District 46, SC (40,384)
- State House District 47, SC (40,075)
- State House District 49, SC (37,806)
- State House District 43, SC (37,678)
- State House District 30, SC (34,013)
Top 10 Neighboring State Legislative District Upper Chamber (by Population) Neighboring State Legislative District Upper Chamber on the Map
- State Senate District 38, NC (238,282)
- State Senate District 39, NC (208,922)
- State Senate District 43, NC (173,686)
- State Senate District 46, NC (165,888)
- State Senate District 15, SC (122,748)
- State Senate District 16, SC (121,820)
- State Senate District 14, SC (98,937)
- State Senate District 17, SC (88,026)
Top 10 Neighboring 111th Congressional District (by Population) Neighboring 111th Congressional District on the Map
- Congressional District 9, NC (852,377)
- Congressional District 4, SC (770,226)
- Congressional District 5, SC (767,773)
- Congressional District 10, NC (689,468)
Top 10 Census Tract in York County (by Population) Neighboring Census Tract on the Map
- Census Tract 610.03, York County, SC (9,298)
- Census Tract 609.05, York County, SC (8,916)
- Census Tract 609.07, York County, SC (8,436)
- Census Tract 615.02, York County, SC (8,210)
- Census Tract 609.06, York County, SC (8,117)
- Census Tract 610.05, York County, SC (8,037)
- Census Tract 615.01, York County, SC (7,730)
- Census Tract 612.01, York County, SC (7,514)
- Census Tract 617.07, York County, SC (7,502)
- Census Tract 610.04, York County, SC (6,951)
Top 10 Neighboring 5-Digit ZIP Code Tabulation Area (by Population) Neighboring 5-Digit ZIP Code Tabulation Area on the Map
- 29732, SC (53,781)
- 29730, SC (52,365)
- 29720, SC (46,041)
- 28052, NC (34,932)
- 28273, NC (31,478)
- 28056, NC (31,418)
- 29710, SC (29,449)
- 29745, SC (28,919)
- 28086, NC (25,895)
- 29708, SC (25,035)
Data
Demographic, Population, Households, and Housing Units
** Data sources from census 2010 **
Show Data on Map
Download Full List as CSV
Download Quick Sheet as CSV
| Subject | This Area | South Carolina | National |
|---|---|---|---|
| POPULATION | |||
| Total Population Map | 226,073 | 4,625,364 | 308,745,538 |
| POPULATION, HISPANIC OR LATINO ORIGIN | |||
| Not Hispanic or Latino Map | 215,998 | 4,389,682 | 258,267,944 |
| Hispanic or Latino Map | 10,075 | 235,682 | 50,477,594 |
| POPULATION, RACE | |||
| White alone Map | 169,158 | 3,060,000 | 223,553,265 |
| Black or African American alone Map | 43,003 | 1,290,684 | 38,929,319 |
| American Indian and Alaska Native alone Map | 1,934 | 19,524 | 2,932,248 |
| Asian alone Map | 3,413 | 59,051 | 14,674,252 |
| Native Hawaiian and Other Pacific Islander alone Map | 126 | 2,706 | 540,013 |
| Some Other Race alone Map | 4,258 | 113,464 | 19,107,368 |
| Two or More Races Map | 4,181 | 79,935 | 9,009,073 |
| POPULATION, SEX | |||
| Male Map | 109,092 | 2,250,101 | 151,781,326 |
| Female Map | 116,981 | 2,375,263 | 156,964,212 |
| POPULATION, AGE (18 YEARS) | |||
| 18 years and over Map | 168,329 | 3,544,890 | 234,564,071 |
| Under 18 years | 57,744 | 1,080,474 | 74,181,467 |
| POPULATION, AGE | |||
| Under 5 years | 15,534 | 302,297 | 20,201,362 |
| 5 to 9 years | 16,228 | 295,853 | 20,348,657 |
| 10 to 14 years | 16,341 | 297,286 | 20,677,194 |
| 15 to 17 years | 9,641 | 185,038 | 12,954,254 |
| 18 and 19 years | 6,467 | 143,951 | 9,086,089 |
| 20 years | 3,098 | 73,846 | 4,519,129 |
| 21 years | 3,123 | 69,700 | 4,354,294 |
| 22 to 24 years | 8,030 | 188,948 | 12,712,576 |
| 25 to 29 years | 13,421 | 304,378 | 21,101,849 |
| 30 to 34 years | 14,306 | 287,678 | 19,962,099 |
| 35 to 39 years | 16,544 | 296,682 | 20,179,642 |
| 40 to 44 years | 17,139 | 304,610 | 20,890,964 |
| 45 to 49 years | 17,691 | 332,766 | 22,708,591 |
| 50 to 54 years | 16,338 | 326,662 | 22,298,125 |
| 55 to 59 years | 14,129 | 303,240 | 19,664,805 |
| 60 and 61 years | 5,207 | 115,411 | 7,113,727 |
| 62 to 64 years | 7,210 | 165,144 | 9,704,197 |
| 65 and 66 years | 3,793 | 92,218 | 5,319,902 |
| 67 to 69 years | 5,176 | 123,343 | 7,115,361 |
| 70 to 74 years | 6,281 | 153,482 | 9,278,166 |
| 75 to 79 years | 4,519 | 113,248 | 7,317,795 |
| 80 to 84 years | 3,085 | 78,866 | 5,743,327 |
| 85 years and over | 2,772 | 70,717 | 5,493,433 |
| MEDIAN AGE BY SEX | |||
| Both sexes Map | 37.20 | 37.90 | 37.20 |
| Male Map | 36.50 | 36.40 | 35.80 |
| Female Map | 37.80 | 39.20 | 38.50 |
| HOUSEHOLDS | |||
| Total Households Map | 85,864 | 1,801,181 | 116,716,292 |
| HOUSEHOLDS, HOUSEHOLD TYPE | |||
| Family households: Map | 61,089 | 1,216,415 | 77,538,296 |
| Husband-wife family Map | 45,151 | 849,959 | 56,510,377 |
| Other family: Map | 15,938 | 366,456 | 21,027,919 |
| Male householder, no wife present Map | 3,960 | 85,354 | 5,777,570 |
| Female householder, no husband present Map | 11,978 | 281,102 | 15,250,349 |
| Nonfamily households: Map | 24,775 | 584,766 | 39,177,996 |
| Householder living alone Map | 20,157 | 477,894 | 31,204,909 |
| Householder not living alone Map | 4,618 | 106,872 | 7,973,087 |
| HOUSEHOLDS, HISPANIC OR LATINO ORIGIN OF HOUSEHOLDER | |||
| Not Hispanic or Latino householder: Map | 83,350 | 1,742,066 | 103,254,926 |
| Hispanic or Latino householder: Map | 2,514 | 59,115 | 13,461,366 |
| HOUSEHOLDS, RACE OF HOUSEHOLDER | |||
| Householder who is White alone | 66,509 | 1,257,573 | 89,754,352 |
| Householder who is Black or African American alone | 15,819 | 472,049 | 14,129,983 |
| Householder who is American Indian and Alaska Native alone | 622 | 7,126 | 939,707 |
| Householder who is Asian alone | 999 | 18,490 | 4,632,164 |
| Householder who is Native Hawaiian and Other Pacific Islander alone | 35 | 754 | 143,932 |
| Householder who is Some Other Race alone | 1,016 | 27,306 | 4,916,427 |
| Householder who is Two or More Races | 864 | 17,883 | 2,199,727 |
| HOUSEHOLDS, HOUSEHOLD TYPE BY HOUSEHOLD SIZE | |||
| Family households: Map | 61,089 | 1,216,415 | 77,538,296 |
| 2-person household Map | 25,439 | 538,874 | 31,882,616 |
| 3-person household Map | 14,827 | 290,093 | 17,765,829 |
| 4-person household Map | 12,589 | 225,690 | 15,214,075 |
| 5-person household Map | 5,367 | 101,650 | 7,411,997 |
| 6-person household Map | 1,852 | 37,394 | 3,026,278 |
| 7-or-more-person household Map | 1,015 | 22,714 | 2,237,501 |
| Nonfamily households: Map | 24,775 | 584,766 | 39,177,996 |
| 1-person household Map | 20,157 | 477,894 | 31,204,909 |
| 2-person household Map | 3,789 | 84,545 | 6,360,012 |
| 3-person household Map | 541 | 14,005 | 992,156 |
| 4-person household Map | 206 | 6,213 | 411,171 |
| 5-person household Map | 47 | 1,364 | 126,634 |
| 6-person household Map | 21 | 439 | 48,421 |
| 7-or-more-person household Map | 14 | 306 | 34,693 |
| HOUSING UNITS | |||
| Total Housing Units Map | 94,196 | 2,137,683 | 131,704,730 |
| HOUSING UNITS, OCCUPANCY STATUS | |||
| Occupied Map | 85,864 | 1,801,181 | 116,716,292 |
| Vacant Map | 8,332 | 336,502 | 14,988,438 |
| HOUSING UNITS, OCCUPIED, TENURE | |||
| Owned with a mortgage or a loan Map | 47,548 | 825,417 | 52,979,430 |
| Owned free and clear Map | 14,571 | 423,388 | 23,006,644 |
| Renter occupied Map | 23,745 | 552,376 | 40,730,218 |
| HOUSING UNITS, VACANT, VACANCY STATUS | |||
| For rent Map | 3,356 | 92,758 | 4,137,567 |
| Rented, not occupied Map | 135 | 3,957 | 206,825 |
| For sale only Map | 1,557 | 36,523 | 1,896,796 |
| Sold, not occupied Map | 284 | 8,519 | 421,032 |
| For seasonal, recreational, or occasional use Map | 850 | 112,531 | 4,649,298 |
| For migrant workers Map | 5 | 370 | 24,161 |
| Other vacant Map | 2,145 | 81,844 | 3,652,759 |
| HOUSING UNITS, OCCUPIED, AVERAGE HOUSEHOLD SIZE BY TENURE | |||
| Total: Map | 2.59 | 2.49 | 2.58 |
| Owner occupied Map | 2.64 | 2.51 | 2.65 |
| Renter occupied Map | 2.45 | 2.45 | 2.44 |
| HOUSING UNITS, OCCUPIED, TENURE BY RACE OF HOUSEHOLDER | |||
| Owner occupied: Map | 62,119 | 1,248,805 | 75,986,074 |
| Householder who is White alone Map | 52,108 | 955,312 | 63,446,275 |
| Householder who is Black or African American alone Map | 7,941 | 258,651 | 6,261,464 |
| Householder who is American Indian and Alaska Native alone Map | 377 | 4,197 | 509,588 |
| Householder who is Asian alone Map | 762 | 11,541 | 2,688,861 |
| Householder who is Native Hawaiian and Other Pacific Islander alone Map | 16 | 310 | 61,911 |
| Householder who is Some Other Race alone Map | 445 | 9,457 | 1,975,817 |
| Householder who is Two or More Races Map | 470 | 9,337 | 1,042,158 |
| Renter occupied: Map | 23,745 | 552,376 | 40,730,218 |
| Householder who is White alone Map | 14,401 | 302,261 | 26,308,077 |
| Householder who is Black or African American alone Map | 7,878 | 213,398 | 7,868,519 |
| Householder who is American Indian and Alaska Native alone Map | 245 | 2,929 | 430,119 |
| Householder who is Asian alone Map | 237 | 6,949 | 1,943,303 |
| Householder who is Native Hawaiian and Other Pacific Islander alone Map | 19 | 444 | 82,021 |
| Householder who is Some Other Race alone Map | 571 | 17,849 | 2,940,610 |
| Householder who is Two or More Races Map | 394 | 8,546 | 1,157,569 |
| HOUSING UNITS, OCCUPIED, TENURE BY HISPANIC OR LATINO ORIGIN OF HOUSEHOLDER | |||
| Owner occupied: Map | 62,119 | 1,248,805 | 75,986,074 |
| Not Hispanic or Latino householder Map | 60,794 | 1,223,564 | 69,617,625 |
| Hispanic or Latino householder Map | 1,325 | 25,241 | 6,368,449 |
| Renter occupied: Map | 23,745 | 552,376 | 40,730,218 |
| Not Hispanic or Latino householder Map | 22,556 | 518,502 | 33,637,301 |
| Hispanic or Latino householder Map | 1,189 | 33,874 | 7,092,917 |
| HOUSING UNITS, OCCUPIED, TENURE BY HOUSEHOLD SIZE | |||
| Owner occupied: Map | 62,119 | 1,248,805 | 75,986,074 |
| 1-person household Map | 12,155 | 289,689 | 16,453,569 |
| 2-person household Map | 22,944 | 477,169 | 27,618,605 |
| 3-person household Map | 11,232 | 210,222 | 12,517,563 |
| 4-person household Map | 9,852 | 164,774 | 10,998,793 |
| 5-person household Map | 3,976 | 69,110 | 5,057,765 |
| 6-person household Map | 1,290 | 24,016 | 1,965,796 |
| 7-or-more-person household Map | 670 | 13,825 | 1,373,983 |
| Renter occupied: Map | 23,745 | 552,376 | 40,730,218 |
| 1-person household Map | 8,002 | 188,205 | 14,751,340 |
| 2-person household Map | 6,284 | 146,250 | 10,624,023 |
| 3-person household Map | 4,136 | 93,876 | 6,240,422 |
| 4-person household Map | 2,943 | 67,129 | 4,626,453 |
| 5-person household Map | 1,438 | 33,904 | 2,480,866 |
| 6-person household Map | 583 | 13,817 | 1,108,903 |
| 7-or-more-person household Map | 359 | 9,195 | 898,211 |
Loading...