


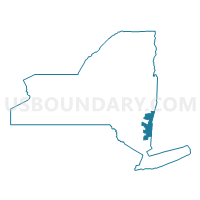
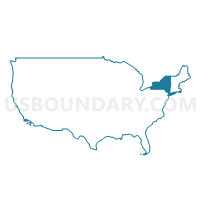
Assembly District 103, New York
About
Outline

Summary
| Unique Area Identifier | 197952 |
| Name | Assembly District 103 |
| State | New York |
| Area (square miles) | 867.08 |
| Land Area (square miles) | 850.11 |
| Water Area (square miles) | 16.97 |
| % of Land Area | 98.04 |
| % of Water Area | 1.96 |
| Latitude of the Internal Point | 41.97189460 |
| Longtitude of the Internal Point | -73.64679780 |
| Total Population | 134,686 |
| Total Housing Units | 58,408 |
| Total Households | 49,559 |
| Median Age | 42.5 |
Maps
Graphs
Select a template below for downloading or customizing gragh for Assembly District 103, New York


Neighbors
Neighoring State Legislative District Lower Chamber (by Name) Neighboring State Legislative District Lower Chamber on the Map
- Assembly District 101, NY
- Assembly District 102, NY
- Assembly District 108, NY
- Assembly District 127, NY
- Assembly District 90, NY
- Assembly District 99, NY
- Fourth Berkshire District, MA
- Second Berkshire District, MA
- State House District 108, CT
- State House District 64, CT
Top 10 Neighboring County (by Population) Neighboring County on the Map
- Fairfield County, CT (916,829)
- Dutchess County, NY (297,488)
- Litchfield County, CT (189,927)
- Ulster County, NY (182,493)
- Berkshire County, MA (131,219)
- Putnam County, NY (99,710)
- Columbia County, NY (63,096)
- Greene County, NY (49,221)
Top 10 Neighboring County Subdivision (by Population) Neighboring County Subdivision on the Map
- Poughkeepsie town, Dutchess County, NY (43,341)
- East Fishkill town, Dutchess County, NY (29,029)
- Wappinger town, Dutchess County, NY (27,048)
- Fishkill town, Dutchess County, NY (22,107)
- Hyde Park town, Dutchess County, NY (21,571)
- Saugerties town, Ulster County, NY (19,482)
- La Grange town, Dutchess County, NY (15,730)
- Beekman town, Dutchess County, NY (14,621)
- Kent town, Putnam County, NY (13,507)
- Ulster town, Ulster County, NY (12,327)
Top 10 Neighboring Place (by Population) Neighboring Place on the Map
- Myers Corner CDP, NY (6,790)
- Hudson city, NY (6,713)
- Catskill village, NY (4,081)
- Saugerties village, NY (3,971)
- Saugerties South CDP, NY (2,218)
- Glasco CDP, NY (2,099)
- Lorenz Park CDP, NY (2,053)
- Red Hook village, NY (1,961)
- Chatham village, NY (1,770)
- Athens village, NY (1,668)
Top 10 Neighboring Elementary School District (by Population) Neighboring Elementary School District on the Map
- Salisbury School District, CT (3,741)
- Sherman School District, CT (3,581)
- Kent School District, CT (2,979)
- Sharon School District, CT (2,782)
- Richmond School District, MA (1,475)
- Hancock School District, MA (717)
Top 10 Neighboring Secondary School District (by Population) Neighboring Secondary School District on the Map
- Regional High School District 01, CT (15,471)
- Pittsfield School District in Richmond (9-12), MA (1,475)
- Mount Greylock/New Lebanon (NY) School Districts in Hancock (7-12), MA (717)
Top 10 Neighboring Unified School District (by Population) Neighboring Unified School District on the Map
- Wappingers Central School District, NY (73,111)
- Arlington Central School District, NY (58,107)
- Kingston City School District, NY (51,596)
- Hyde Park Central School District, NY (32,065)
- Carmel Central School District, NY (30,273)
- Saugerties Central School District, NY (20,744)
- Hudson City School District, NY (16,078)
- Red Hook Central School District, NY (14,033)
- Kinderhook Central School District, NY (13,856)
- Coxsackie-Athens Central School District, NY (12,764)
Top 10 Neighboring State Legislative District Upper Chamber (by Population) Neighboring State Legislative District Upper Chamber on the Map
- State Senate District 41, NY (316,491)
- State Senate District 40, NY (316,324)
- State Senate District 42, NY (313,027)
- State Senate District 51, NY (296,420)
- Berkshire, Hampshire & Franklin District, MA (149,418)
- State Senate District 24, CT (104,062)
- State Senate District 30, CT (102,325)
Top 10 Neighboring 111th Congressional District (by Population) Neighboring 111th Congressional District on the Map
- Congressional District 5, CT (714,296)
- Congressional District 19, NY (699,959)
- Congressional District 20, NY (683,198)
- Congressional District 22, NY (679,297)
- Congressional District 1, MA (644,956)
Top 10 Neighboring Census Tract (by Population) Neighboring Census Tract on the Map
- Census Tract 1402, Dutchess County, NY (7,124)
- Census Tract 501.04, Dutchess County, NY (6,471)
- Census Tract 703.01, Dutchess County, NY (6,243)
- Census Tract 10, Columbia County, NY (6,021)
- Census Tract 501.03, Dutchess County, NY (5,572)
- Census Tract 502.05, Dutchess County, NY (5,449)
- Census Tract 200.05, Dutchess County, NY (5,425)
- Census Tract 7, Columbia County, NY (5,402)
- Census Tract 105, Putnam County, NY (5,225)
- Census Tract 1902.04, Dutchess County, NY (5,149)
Top 10 Neighboring 5-Digit ZIP Code Tabulation Area (by Population) Neighboring 5-Digit ZIP Code Tabulation Area on the Map
- 01201, MA (46,504)
- 12601, NY (43,398)
- 12603, NY (42,810)
- 12590, NY (35,102)
- 10512, NY (25,590)
- 12533, NY (25,307)
- 12534, NY (17,867)
- 12524, NY (15,598)
- 12538, NY (14,578)
- 12571, NY (9,918)
Data
Demographic, Population, Households, and Housing Units
** Data sources from census 2010 **
Show Data on Map
Download Full List as CSV
Download Quick Sheet as CSV
| Subject | This Area | New York | National |
|---|---|---|---|
| POPULATION | |||
| Total Population Map | 134,686 | 19,378,102 | 308,745,538 |
| POPULATION, HISPANIC OR LATINO ORIGIN | |||
| Not Hispanic or Latino Map | 125,745 | 15,961,180 | 258,267,944 |
| Hispanic or Latino Map | 8,941 | 3,416,922 | 50,477,594 |
| POPULATION, RACE | |||
| White alone Map | 118,987 | 12,740,974 | 223,553,265 |
| Black or African American alone Map | 6,792 | 3,073,800 | 38,929,319 |
| American Indian and Alaska Native alone Map | 265 | 106,906 | 2,932,248 |
| Asian alone Map | 3,178 | 1,420,244 | 14,674,252 |
| Native Hawaiian and Other Pacific Islander alone Map | 48 | 8,766 | 540,013 |
| Some Other Race alone Map | 2,677 | 1,441,563 | 19,107,368 |
| Two or More Races Map | 2,739 | 585,849 | 9,009,073 |
| POPULATION, SEX | |||
| Male Map | 68,332 | 9,377,147 | 151,781,326 |
| Female Map | 66,354 | 10,000,955 | 156,964,212 |
| POPULATION, AGE (18 YEARS) | |||
| 18 years and over Map | 103,892 | 15,053,173 | 234,564,071 |
| Under 18 years | 30,794 | 4,324,929 | 74,181,467 |
| POPULATION, AGE | |||
| Under 5 years | 6,530 | 1,155,822 | 20,201,362 |
| 5 to 9 years | 8,290 | 1,163,955 | 20,348,657 |
| 10 to 14 years | 9,448 | 1,211,456 | 20,677,194 |
| 15 to 17 years | 6,526 | 793,696 | 12,954,254 |
| 18 and 19 years | 3,996 | 572,582 | 9,086,089 |
| 20 years | 1,746 | 293,083 | 4,519,129 |
| 21 years | 1,659 | 281,596 | 4,354,294 |
| 22 to 24 years | 4,318 | 836,256 | 12,712,576 |
| 25 to 29 years | 5,947 | 1,380,177 | 21,101,849 |
| 30 to 34 years | 6,105 | 1,279,160 | 19,962,099 |
| 35 to 39 years | 7,825 | 1,254,124 | 20,179,642 |
| 40 to 44 years | 10,520 | 1,355,893 | 20,890,964 |
| 45 to 49 years | 12,314 | 1,458,763 | 22,708,591 |
| 50 to 54 years | 11,977 | 1,419,928 | 22,298,125 |
| 55 to 59 years | 10,316 | 1,237,408 | 19,664,805 |
| 60 and 61 years | 3,472 | 453,993 | 7,113,727 |
| 62 to 64 years | 5,029 | 612,267 | 9,704,197 |
| 65 and 66 years | 2,612 | 330,160 | 5,319,902 |
| 67 to 69 years | 3,525 | 443,051 | 7,115,361 |
| 70 to 74 years | 4,357 | 587,391 | 9,278,166 |
| 75 to 79 years | 3,395 | 474,807 | 7,317,795 |
| 80 to 84 years | 2,522 | 391,660 | 5,743,327 |
| 85 years and over | 2,257 | 390,874 | 5,493,433 |
| MEDIAN AGE BY SEX | |||
| Both sexes Map | 42.50 | 38.00 | 37.20 |
| Male Map | 41.80 | 36.30 | 35.80 |
| Female Map | 43.10 | 39.40 | 38.50 |
| HOUSEHOLDS | |||
| Total Households Map | 49,559 | 7,317,755 | 116,716,292 |
| HOUSEHOLDS, HOUSEHOLD TYPE | |||
| Family households: Map | 34,649 | 4,649,791 | 77,538,296 |
| Husband-wife family Map | 27,577 | 3,192,903 | 56,510,377 |
| Other family: Map | 7,072 | 1,456,888 | 21,027,919 |
| Male householder, no wife present Map | 2,329 | 366,948 | 5,777,570 |
| Female householder, no husband present Map | 4,743 | 1,089,940 | 15,250,349 |
| Nonfamily households: Map | 14,910 | 2,667,964 | 39,177,996 |
| Householder living alone Map | 11,864 | 2,130,670 | 31,204,909 |
| Householder not living alone Map | 3,046 | 537,294 | 7,973,087 |
| HOUSEHOLDS, HISPANIC OR LATINO ORIGIN OF HOUSEHOLDER | |||
| Not Hispanic or Latino householder: Map | 47,395 | 6,311,241 | 103,254,926 |
| Hispanic or Latino householder: Map | 2,164 | 1,006,514 | 13,461,366 |
| HOUSEHOLDS, RACE OF HOUSEHOLDER | |||
| Householder who is White alone | 45,692 | 5,169,163 | 89,754,352 |
| Householder who is Black or African American alone | 1,712 | 1,095,790 | 14,129,983 |
| Householder who is American Indian and Alaska Native alone | 91 | 33,824 | 939,707 |
| Householder who is Asian alone | 853 | 445,652 | 4,632,164 |
| Householder who is Native Hawaiian and Other Pacific Islander alone | 17 | 2,615 | 143,932 |
| Householder who is Some Other Race alone | 632 | 405,320 | 4,916,427 |
| Householder who is Two or More Races | 562 | 165,391 | 2,199,727 |
| HOUSEHOLDS, HOUSEHOLD TYPE BY HOUSEHOLD SIZE | |||
| Family households: Map | 34,649 | 4,649,791 | 77,538,296 |
| 2-person household Map | 14,251 | 1,785,206 | 31,882,616 |
| 3-person household Map | 7,900 | 1,109,716 | 17,765,829 |
| 4-person household Map | 7,438 | 944,590 | 15,214,075 |
| 5-person household Map | 3,327 | 461,667 | 7,411,997 |
| 6-person household Map | 1,196 | 189,577 | 3,026,278 |
| 7-or-more-person household Map | 537 | 159,035 | 2,237,501 |
| Nonfamily households: Map | 14,910 | 2,667,964 | 39,177,996 |
| 1-person household Map | 11,864 | 2,130,670 | 31,204,909 |
| 2-person household Map | 2,614 | 430,564 | 6,360,012 |
| 3-person household Map | 242 | 66,787 | 992,156 |
| 4-person household Map | 123 | 24,877 | 411,171 |
| 5-person household Map | 41 | 8,596 | 126,634 |
| 6-person household Map | 14 | 3,400 | 48,421 |
| 7-or-more-person household Map | 12 | 3,070 | 34,693 |
| HOUSING UNITS | |||
| Total Housing Units Map | 58,408 | 8,108,103 | 131,704,730 |
| HOUSING UNITS, OCCUPANCY STATUS | |||
| Occupied Map | 49,559 | 7,317,755 | 116,716,292 |
| Vacant Map | 8,849 | 790,348 | 14,988,438 |
| HOUSING UNITS, OCCUPIED, TENURE | |||
| Owned with a mortgage or a loan Map | 25,828 | 2,610,123 | 52,979,430 |
| Owned free and clear Map | 11,540 | 1,287,714 | 23,006,644 |
| Renter occupied Map | 12,191 | 3,419,918 | 40,730,218 |
| HOUSING UNITS, VACANT, VACANCY STATUS | |||
| For rent Map | 1,133 | 200,039 | 4,137,567 |
| Rented, not occupied Map | 57 | 12,786 | 206,825 |
| For sale only Map | 780 | 77,225 | 1,896,796 |
| Sold, not occupied Map | 198 | 21,027 | 421,032 |
| For seasonal, recreational, or occasional use Map | 5,154 | 289,301 | 4,649,298 |
| For migrant workers Map | 13 | 892 | 24,161 |
| Other vacant Map | 1,514 | 189,078 | 3,652,759 |
| HOUSING UNITS, OCCUPIED, AVERAGE HOUSEHOLD SIZE BY TENURE | |||
| Total: Map | 2.59 | 2.57 | 2.58 |
| Owner occupied Map | 2.71 | 2.71 | 2.65 |
| Renter occupied Map | 2.24 | 2.41 | 2.44 |
| HOUSING UNITS, OCCUPIED, TENURE BY RACE OF HOUSEHOLDER | |||
| Owner occupied: Map | 37,368 | 3,897,837 | 75,986,074 |
| Householder who is White alone Map | 35,209 | 3,237,592 | 63,446,275 |
| Householder who is Black or African American alone Map | 845 | 325,395 | 6,261,464 |
| Householder who is American Indian and Alaska Native alone Map | 47 | 11,250 | 509,588 |
| Householder who is Asian alone Map | 658 | 197,011 | 2,688,861 |
| Householder who is Native Hawaiian and Other Pacific Islander alone Map | 13 | 741 | 61,911 |
| Householder who is Some Other Race alone Map | 285 | 74,243 | 1,975,817 |
| Householder who is Two or More Races Map | 311 | 51,605 | 1,042,158 |
| Renter occupied: Map | 12,191 | 3,419,918 | 40,730,218 |
| Householder who is White alone Map | 10,483 | 1,931,571 | 26,308,077 |
| Householder who is Black or African American alone Map | 867 | 770,395 | 7,868,519 |
| Householder who is American Indian and Alaska Native alone Map | 44 | 22,574 | 430,119 |
| Householder who is Asian alone Map | 195 | 248,641 | 1,943,303 |
| Householder who is Native Hawaiian and Other Pacific Islander alone Map | 4 | 1,874 | 82,021 |
| Householder who is Some Other Race alone Map | 347 | 331,077 | 2,940,610 |
| Householder who is Two or More Races Map | 251 | 113,786 | 1,157,569 |
| HOUSING UNITS, OCCUPIED, TENURE BY HISPANIC OR LATINO ORIGIN OF HOUSEHOLDER | |||
| Owner occupied: Map | 37,368 | 3,897,837 | 75,986,074 |
| Not Hispanic or Latino householder Map | 36,096 | 3,664,784 | 69,617,625 |
| Hispanic or Latino householder Map | 1,272 | 233,053 | 6,368,449 |
| Renter occupied: Map | 12,191 | 3,419,918 | 40,730,218 |
| Not Hispanic or Latino householder Map | 11,299 | 2,646,457 | 33,637,301 |
| Hispanic or Latino householder Map | 892 | 773,461 | 7,092,917 |
| HOUSING UNITS, OCCUPIED, TENURE BY HOUSEHOLD SIZE | |||
| Owner occupied: Map | 37,368 | 3,897,837 | 75,986,074 |
| 1-person household Map | 6,985 | 860,611 | 16,453,569 |
| 2-person household Map | 13,578 | 1,304,752 | 27,618,605 |
| 3-person household Map | 6,348 | 660,251 | 12,517,563 |
| 4-person household Map | 6,322 | 606,580 | 10,998,793 |
| 5-person household Map | 2,752 | 279,929 | 5,057,765 |
| 6-person household Map | 973 | 106,323 | 1,965,796 |
| 7-or-more-person household Map | 410 | 79,391 | 1,373,983 |
| Renter occupied: Map | 12,191 | 3,419,918 | 40,730,218 |
| 1-person household Map | 4,879 | 1,270,059 | 14,751,340 |
| 2-person household Map | 3,287 | 911,018 | 10,624,023 |
| 3-person household Map | 1,794 | 516,252 | 6,240,422 |
| 4-person household Map | 1,239 | 362,887 | 4,626,453 |
| 5-person household Map | 616 | 190,334 | 2,480,866 |
| 6-person household Map | 237 | 86,654 | 1,108,903 |
| 7-or-more-person household Map | 139 | 82,714 | 898,211 |
Loading...