


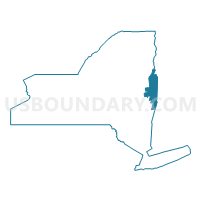
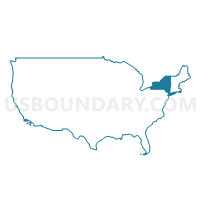
Assembly District 112, New York
About
Outline

Summary
| Unique Area Identifier | 197919 |
| Name | Assembly District 112 |
| State | New York |
| Area (square miles) | 1,367.16 |
| Land Area (square miles) | 1,338.30 |
| Water Area (square miles) | 28.86 |
| % of Land Area | 97.89 |
| % of Water Area | 2.11 |
| Latitude of the Internal Point | 43.13509410 |
| Longtitude of the Internal Point | -73.46738330 |
| Total Population | 139,495 |
| Total Housing Units | 62,979 |
| Total Households | 54,723 |
| Median Age | 41.3 |
Maps
Graphs
Select a template below for downloading or customizing gragh for Assembly District 112, New York


Neighbors
Neighoring State Legislative District Lower Chamber (by Name) Neighboring State Legislative District Lower Chamber on the Map
- Addison-Rutland-1 State House District, VT
- Assembly District 108, NY
- Assembly District 109, NY
- Assembly District 110, NY
- Assembly District 113, NY
- Bennington-1 State House District, VT
- Bennington-2-1 State House District, VT
- Bennington-3 State House District, VT
- Bennington-5 State House District, VT
- First Berkshire District, MA
- Rutland-1-1 State House District, VT
- Rutland-2 State House District, VT
- Rutland-8 State House District, VT
- Second Berkshire District, MA
Top 10 Neighboring County (by Population) Neighboring County on the Map
- Saratoga County, NY (219,607)
- Rensselaer County, NY (159,429)
- Berkshire County, MA (131,219)
- Warren County, NY (65,707)
- Washington County, NY (63,216)
- Columbia County, NY (63,096)
- Rutland County, VT (61,642)
- Essex County, NY (39,370)
- Bennington County, VT (37,125)
- Addison County, VT (36,821)
Top 10 Neighboring County Subdivision (by Population) Neighboring County Subdivision on the Map
- Clifton Park town, Saratoga County, NY (36,705)
- Queensbury town, Warren County, NY (27,901)
- Saratoga Springs city, Saratoga County, NY (26,586)
- Halfmoon town, Saratoga County, NY (21,535)
- Milton town, Saratoga County, NY (18,575)
- Wilton town, Saratoga County, NY (16,173)
- Bennington town, Bennington County, VT (15,764)
- Malta town, Saratoga County, NY (14,765)
- Moreau town, Saratoga County, NY (14,728)
- Kingsbury town, Washington County, NY (12,671)
Top 10 Neighboring Place (by Population) Neighboring Place on the Map
- Saratoga Springs city, NY (26,586)
- Hudson Falls village, NY (7,281)
- Mechanicville city, NY (5,196)
- Hoosick Falls village, NY (3,501)
- Fort Edward village, NY (3,375)
- Whitehall village, NY (2,614)
- Granville village, NY (2,543)
- Country Knolls CDP, NY (2,224)
- Cambridge village, NY (1,870)
- Greenwich village, NY (1,777)
Top 10 Neighboring Elementary School District (by Population) Neighboring Elementary School District on the Map
- Bennington Incorporated School District, VT (14,121)
- Williamstown School District, MA (7,754)
- Pownal School District, VT (3,527)
- Shaftsbury School District, VT (2,853)
- Fair Haven School District, VT (2,734)
- Mettawee Community Union School District 47, VT (2,191)
- Orwell School District, VT (1,250)
- Wells School District, VT (1,150)
- Benson School District, VT (1,056)
- Hancock School District, MA (717)
Top 10 Neighboring Secondary School District (by Population) Neighboring Secondary School District on the Map
- Mount Anthony Union High School District 14, VT (23,305)
- Mount Greylock School District, MA (11,073)
- Fair Haven Union High School District 16, VT (10,727)
- Pawlet School District, VT (1,477)
- Mount Greylock/New Lebanon (NY) School Districts in Hancock (7-12), MA (717)
- Rupert School District, VT (714)
Top 10 Neighboring Unified School District (by Population) Neighboring Unified School District on the Map
- Shenendehowa Central School District, NY (62,406)
- Saratoga Springs City School District, NY (49,070)
- Ballston Spa Central School District, NY (27,535)
- Queensbury Union Free School District, NY (22,046)
- South Glens Falls Central School District, NY (19,546)
- Averill Park Central School District, NY (19,313)
- Lansingburgh Central School District, NY (17,151)
- Hudson Falls Central School District, NY (15,389)
- Schuylerville Central School District, NY (9,881)
- Mechanicville City School District, NY (9,536)
Top 10 Neighboring State Legislative District Upper Chamber (by Population) Neighboring State Legislative District Upper Chamber on the Map
- State Senate District 43, NY (322,103)
- State Senate District 44, NY (317,410)
- State Senate District 41, NY (316,491)
- State Senate District 45, NY (306,856)
- Berkshire, Hampshire & Franklin District, MA (149,418)
- Rutland State Senate District, VT (57,676)
- Addison State Senate District, VT (40,787)
- Bennington State Senate District, VT (39,001)
Top 10 Neighboring 111th Congressional District (by Population) Neighboring 111th Congressional District on the Map
- Congressional District 20, NY (683,198)
- Congressional District 23, NY (664,245)
- Congressional District 1, MA (644,956)
- Congressional District (at Large), VT (625,741)
Top 10 Neighboring Census Tract (by Population) Neighboring Census Tract on the Map
- Census Tract 607.02, Saratoga County, NY (9,095)
- Census Tract 619.01, Saratoga County, NY (8,977)
- Census Tract 607.01, Saratoga County, NY (7,078)
- Census Tract 840, Washington County, NY (6,669)
- Census Tract 620, Saratoga County, NY (6,618)
- Census Tract 880, Washington County, NY (6,371)
- Census Tract 601.01, Saratoga County, NY (6,199)
- Census Tract 810, Washington County, NY (6,190)
- Census Tract 522.03, Rensselaer County, NY (6,000)
- Census Tract 614.03, Saratoga County, NY (5,930)
Top 10 Neighboring 5-Digit ZIP Code Tabulation Area (by Population) Neighboring 5-Digit ZIP Code Tabulation Area on the Map
- 12180, NY (53,606)
- 12065, NY (41,776)
- 12866, NY (36,915)
- 12020, NY (31,192)
- 12804, NY (26,540)
- 12831, NY (17,416)
- 05201, VT (14,851)
- 12019, NY (14,740)
- 12182, NY (14,733)
- 12118, NY (13,897)
Data
Demographic, Population, Households, and Housing Units
** Data sources from census 2010 **
Show Data on Map
Download Full List as CSV
Download Quick Sheet as CSV
| Subject | This Area | New York | National |
|---|---|---|---|
| POPULATION | |||
| Total Population Map | 139,495 | 19,378,102 | 308,745,538 |
| POPULATION, HISPANIC OR LATINO ORIGIN | |||
| Not Hispanic or Latino Map | 136,525 | 15,961,180 | 258,267,944 |
| Hispanic or Latino Map | 2,970 | 3,416,922 | 50,477,594 |
| POPULATION, RACE | |||
| White alone Map | 133,178 | 12,740,974 | 223,553,265 |
| Black or African American alone Map | 2,589 | 3,073,800 | 38,929,319 |
| American Indian and Alaska Native alone Map | 322 | 106,906 | 2,932,248 |
| Asian alone Map | 888 | 1,420,244 | 14,674,252 |
| Native Hawaiian and Other Pacific Islander alone Map | 23 | 8,766 | 540,013 |
| Some Other Race alone Map | 749 | 1,441,563 | 19,107,368 |
| Two or More Races Map | 1,746 | 585,849 | 9,009,073 |
| POPULATION, SEX | |||
| Male Map | 70,416 | 9,377,147 | 151,781,326 |
| Female Map | 69,079 | 10,000,955 | 156,964,212 |
| POPULATION, AGE (18 YEARS) | |||
| 18 years and over Map | 108,225 | 15,053,173 | 234,564,071 |
| Under 18 years | 31,270 | 4,324,929 | 74,181,467 |
| POPULATION, AGE | |||
| Under 5 years | 7,808 | 1,155,822 | 20,201,362 |
| 5 to 9 years | 8,461 | 1,163,955 | 20,348,657 |
| 10 to 14 years | 9,212 | 1,211,456 | 20,677,194 |
| 15 to 17 years | 5,789 | 793,696 | 12,954,254 |
| 18 and 19 years | 3,240 | 572,582 | 9,086,089 |
| 20 years | 1,608 | 293,083 | 4,519,129 |
| 21 years | 1,449 | 281,596 | 4,354,294 |
| 22 to 24 years | 4,658 | 836,256 | 12,712,576 |
| 25 to 29 years | 7,642 | 1,380,177 | 21,101,849 |
| 30 to 34 years | 8,179 | 1,279,160 | 19,962,099 |
| 35 to 39 years | 8,969 | 1,254,124 | 20,179,642 |
| 40 to 44 years | 10,791 | 1,355,893 | 20,890,964 |
| 45 to 49 years | 11,844 | 1,458,763 | 22,708,591 |
| 50 to 54 years | 11,370 | 1,419,928 | 22,298,125 |
| 55 to 59 years | 9,981 | 1,237,408 | 19,664,805 |
| 60 and 61 years | 3,631 | 453,993 | 7,113,727 |
| 62 to 64 years | 5,019 | 612,267 | 9,704,197 |
| 65 and 66 years | 2,791 | 330,160 | 5,319,902 |
| 67 to 69 years | 3,681 | 443,051 | 7,115,361 |
| 70 to 74 years | 4,452 | 587,391 | 9,278,166 |
| 75 to 79 years | 3,580 | 474,807 | 7,317,795 |
| 80 to 84 years | 2,789 | 391,660 | 5,743,327 |
| 85 years and over | 2,551 | 390,874 | 5,493,433 |
| MEDIAN AGE BY SEX | |||
| Both sexes Map | 41.30 | 38.00 | 37.20 |
| Male Map | 40.20 | 36.30 | 35.80 |
| Female Map | 42.40 | 39.40 | 38.50 |
| HOUSEHOLDS | |||
| Total Households Map | 54,723 | 7,317,755 | 116,716,292 |
| HOUSEHOLDS, HOUSEHOLD TYPE | |||
| Family households: Map | 37,043 | 4,649,791 | 77,538,296 |
| Husband-wife family Map | 28,613 | 3,192,903 | 56,510,377 |
| Other family: Map | 8,430 | 1,456,888 | 21,027,919 |
| Male householder, no wife present Map | 2,838 | 366,948 | 5,777,570 |
| Female householder, no husband present Map | 5,592 | 1,089,940 | 15,250,349 |
| Nonfamily households: Map | 17,680 | 2,667,964 | 39,177,996 |
| Householder living alone Map | 13,682 | 2,130,670 | 31,204,909 |
| Householder not living alone Map | 3,998 | 537,294 | 7,973,087 |
| HOUSEHOLDS, HISPANIC OR LATINO ORIGIN OF HOUSEHOLDER | |||
| Not Hispanic or Latino householder: Map | 54,043 | 6,311,241 | 103,254,926 |
| Hispanic or Latino householder: Map | 680 | 1,006,514 | 13,461,366 |
| HOUSEHOLDS, RACE OF HOUSEHOLDER | |||
| Householder who is White alone | 53,452 | 5,169,163 | 89,754,352 |
| Householder who is Black or African American alone | 341 | 1,095,790 | 14,129,983 |
| Householder who is American Indian and Alaska Native alone | 118 | 33,824 | 939,707 |
| Householder who is Asian alone | 216 | 445,652 | 4,632,164 |
| Householder who is Native Hawaiian and Other Pacific Islander alone | 7 | 2,615 | 143,932 |
| Householder who is Some Other Race alone | 157 | 405,320 | 4,916,427 |
| Householder who is Two or More Races | 432 | 165,391 | 2,199,727 |
| HOUSEHOLDS, HOUSEHOLD TYPE BY HOUSEHOLD SIZE | |||
| Family households: Map | 37,043 | 4,649,791 | 77,538,296 |
| 2-person household Map | 16,386 | 1,785,206 | 31,882,616 |
| 3-person household Map | 8,764 | 1,109,716 | 17,765,829 |
| 4-person household Map | 7,397 | 944,590 | 15,214,075 |
| 5-person household Map | 3,024 | 461,667 | 7,411,997 |
| 6-person household Map | 978 | 189,577 | 3,026,278 |
| 7-or-more-person household Map | 494 | 159,035 | 2,237,501 |
| Nonfamily households: Map | 17,680 | 2,667,964 | 39,177,996 |
| 1-person household Map | 13,682 | 2,130,670 | 31,204,909 |
| 2-person household Map | 3,498 | 430,564 | 6,360,012 |
| 3-person household Map | 307 | 66,787 | 992,156 |
| 4-person household Map | 112 | 24,877 | 411,171 |
| 5-person household Map | 44 | 8,596 | 126,634 |
| 6-person household Map | 18 | 3,400 | 48,421 |
| 7-or-more-person household Map | 19 | 3,070 | 34,693 |
| HOUSING UNITS | |||
| Total Housing Units Map | 62,979 | 8,108,103 | 131,704,730 |
| HOUSING UNITS, OCCUPANCY STATUS | |||
| Occupied Map | 54,723 | 7,317,755 | 116,716,292 |
| Vacant Map | 8,256 | 790,348 | 14,988,438 |
| HOUSING UNITS, OCCUPIED, TENURE | |||
| Owned with a mortgage or a loan Map | 27,086 | 2,610,123 | 52,979,430 |
| Owned free and clear Map | 13,281 | 1,287,714 | 23,006,644 |
| Renter occupied Map | 14,356 | 3,419,918 | 40,730,218 |
| HOUSING UNITS, VACANT, VACANCY STATUS | |||
| For rent Map | 1,148 | 200,039 | 4,137,567 |
| Rented, not occupied Map | 83 | 12,786 | 206,825 |
| For sale only Map | 815 | 77,225 | 1,896,796 |
| Sold, not occupied Map | 251 | 21,027 | 421,032 |
| For seasonal, recreational, or occasional use Map | 4,461 | 289,301 | 4,649,298 |
| For migrant workers Map | 18 | 892 | 24,161 |
| Other vacant Map | 1,480 | 189,078 | 3,652,759 |
| HOUSING UNITS, OCCUPIED, AVERAGE HOUSEHOLD SIZE BY TENURE | |||
| Total: Map | 2.49 | 2.57 | 2.58 |
| Owner occupied Map | 2.60 | 2.71 | 2.65 |
| Renter occupied Map | 2.18 | 2.41 | 2.44 |
| HOUSING UNITS, OCCUPIED, TENURE BY RACE OF HOUSEHOLDER | |||
| Owner occupied: Map | 40,367 | 3,897,837 | 75,986,074 |
| Householder who is White alone Map | 39,625 | 3,237,592 | 63,446,275 |
| Householder who is Black or African American alone Map | 185 | 325,395 | 6,261,464 |
| Householder who is American Indian and Alaska Native alone Map | 66 | 11,250 | 509,588 |
| Householder who is Asian alone Map | 148 | 197,011 | 2,688,861 |
| Householder who is Native Hawaiian and Other Pacific Islander alone Map | 5 | 741 | 61,911 |
| Householder who is Some Other Race alone Map | 64 | 74,243 | 1,975,817 |
| Householder who is Two or More Races Map | 274 | 51,605 | 1,042,158 |
| Renter occupied: Map | 14,356 | 3,419,918 | 40,730,218 |
| Householder who is White alone Map | 13,827 | 1,931,571 | 26,308,077 |
| Householder who is Black or African American alone Map | 156 | 770,395 | 7,868,519 |
| Householder who is American Indian and Alaska Native alone Map | 52 | 22,574 | 430,119 |
| Householder who is Asian alone Map | 68 | 248,641 | 1,943,303 |
| Householder who is Native Hawaiian and Other Pacific Islander alone Map | 2 | 1,874 | 82,021 |
| Householder who is Some Other Race alone Map | 93 | 331,077 | 2,940,610 |
| Householder who is Two or More Races Map | 158 | 113,786 | 1,157,569 |
| HOUSING UNITS, OCCUPIED, TENURE BY HISPANIC OR LATINO ORIGIN OF HOUSEHOLDER | |||
| Owner occupied: Map | 40,367 | 3,897,837 | 75,986,074 |
| Not Hispanic or Latino householder Map | 39,993 | 3,664,784 | 69,617,625 |
| Hispanic or Latino householder Map | 374 | 233,053 | 6,368,449 |
| Renter occupied: Map | 14,356 | 3,419,918 | 40,730,218 |
| Not Hispanic or Latino householder Map | 14,050 | 2,646,457 | 33,637,301 |
| Hispanic or Latino householder Map | 306 | 773,461 | 7,092,917 |
| HOUSING UNITS, OCCUPIED, TENURE BY HOUSEHOLD SIZE | |||
| Owner occupied: Map | 40,367 | 3,897,837 | 75,986,074 |
| 1-person household Map | 7,826 | 860,611 | 16,453,569 |
| 2-person household Map | 15,803 | 1,304,752 | 27,618,605 |
| 3-person household Map | 7,016 | 660,251 | 12,517,563 |
| 4-person household Map | 6,148 | 606,580 | 10,998,793 |
| 5-person household Map | 2,402 | 279,929 | 5,057,765 |
| 6-person household Map | 796 | 106,323 | 1,965,796 |
| 7-or-more-person household Map | 376 | 79,391 | 1,373,983 |
| Renter occupied: Map | 14,356 | 3,419,918 | 40,730,218 |
| 1-person household Map | 5,856 | 1,270,059 | 14,751,340 |
| 2-person household Map | 4,081 | 911,018 | 10,624,023 |
| 3-person household Map | 2,055 | 516,252 | 6,240,422 |
| 4-person household Map | 1,361 | 362,887 | 4,626,453 |
| 5-person household Map | 666 | 190,334 | 2,480,866 |
| 6-person household Map | 200 | 86,654 | 1,108,903 |
| 7-or-more-person household Map | 137 | 82,714 | 898,211 |
Loading...