


State Senate District 15, California
About
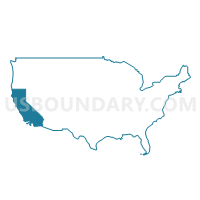
Outline

Summary
| Unique Area Identifier | 199904 |
| Name | State Senate District 15 |
| State | California |
| Area (square miles) | 7,631.93 |
| Land Area (square miles) | 6,760.79 |
| Water Area (square miles) | 871.14 |
| % of Land Area | 88.59 |
| % of Water Area | 11.41 |
| Latitude of the Internal Point | 35.86017410 |
| Longtitude of the Internal Point | -120.91802710 |
| Total Population | 903,066 |
| Total Housing Units | 350,261 |
| Total Households | 316,399 |
| Median Age | 38.7 |
Maps

Graphs
Select a template below for downloading or customizing gragh for State Senate District 15, California


Neighbors
Neighoring State Legislative District Upper Chamber (by Name) Neighboring State Legislative District Upper Chamber on the Map
- State Senate District 11, CA
- State Senate District 12, CA
- State Senate District 13, CA
- State Senate District 16, CA
- State Senate District 18, CA
- State Senate District 19, CA
Top 10 Neighboring County (by Population) Neighboring County on the Map
- Santa Clara County, CA (1,781,642)
- Fresno County, CA (930,450)
- Kern County, CA (839,631)
- Santa Barbara County, CA (423,895)
- Monterey County, CA (415,057)
- San Luis Obispo County, CA (269,637)
- Santa Cruz County, CA (262,382)
- Kings County, CA (152,982)
- San Benito County, CA (55,269)
Top 10 Neighboring County Subdivision (by Population) Neighboring County Subdivision on the Map
- San Jose CCD, Santa Clara County, CA (1,661,105)
- Salinas CCD, Monterey County, CA (163,203)
- Santa Cruz CCD, Santa Cruz County, CA (154,331)
- Santa Maria CCD, Santa Barbara County, CA (132,726)
- Seaside-Monterey CCD, Monterey County, CA (107,513)
- South Santa Clara Valley CCD, Santa Clara County, CA (103,477)
- Watsonville CCD, Santa Cruz County, CA (77,150)
- Arroyo Grande CCD, San Luis Obispo County, CA (76,029)
- San Luis Obispo CCD, San Luis Obispo County, CA (64,447)
- Lompoc CCD, Santa Barbara County, CA (57,742)
Top 10 Neighboring Place (by Population) Neighboring Place on the Map
- San Jose city, CA (945,942)
- Salinas city, CA (150,441)
- Santa Maria city, CA (99,553)
- Santa Cruz city, CA (59,946)
- Cupertino city, CA (58,302)
- Watsonville city, CA (51,199)
- Gilroy city, CA (48,821)
- San Luis Obispo city, CA (45,119)
- Campbell city, CA (39,349)
- Morgan Hill city, CA (37,882)
Top 10 Neighboring Elementary School District (by Population) Neighboring Elementary School District on the Map
- Cupertino Union Elementary School District, CA (138,600)
- Alum Rock Union Elementary School District, CA (110,168)
- Oak Grove Elementary School District, CA (104,443)
- Evergreen Elementary School District, CA (99,633)
- Santa Maria-Bonita Elementary School District, CA (98,324)
- Campbell Union Elementary School District, CA (94,394)
- Franklin-McKinley Elementary School District, CA (89,911)
- Salinas City Elementary School District, CA (77,623)
- Santa Cruz City Elementary School District, CA (62,259)
- Alisal Union Elementary School District, CA (57,280)
Top 10 Neighboring Secondary School District (by Population) Neighboring Secondary School District on the Map
- East Side Union High School District, CA (523,132)
- Fremont Union High School District, CA (223,745)
- Campbell Union High School District, CA (220,303)
- Salinas Union High School District, CA (171,122)
- Santa Maria Joint Union High School District, CA (142,483)
- Santa Cruz City High School District, CA (91,185)
- Los Gatos-Saratoga Joint Union School District, CA (53,209)
- King City Joint Union High School District, CA (36,916)
- Wasco Union High School District, CA (29,934)
- Santa Cruz City High School District (9-12) in Soquel, CA (26,210)
Top 10 Neighboring Unified School District (by Population) Neighboring Unified School District on the Map
- San Jose Unified School District, CA (251,156)
- Pajaro Valley Joint Unified School District, CA (114,178)
- San Luis Coastal Unified School District, CA (90,912)
- Monterey Peninsula Unified School District, CA (87,070)
- Lucia Mar Unified School District, CA (74,957)
- Morgan Hill Unified School District, CA (59,911)
- Gilroy Unified School District, CA (57,879)
- Paso Robles Joint Unified School District, CA (40,237)
- Atascadero Unified School District, CA (35,787)
- North Monterey County Unified School District, CA (26,701)
Top 10 Neighboring State Legislative District Lower Chamber (by Population) Neighboring State Legislative District Lower Chamber on the Map
- Assembly District 32, CA (547,084)
- Assembly District 30, CA (504,729)
- Assembly District 33, CA (469,458)
- Assembly District 22, CA (463,391)
- Assembly District 28, CA (462,750)
- Assembly District 35, CA (451,555)
- Assembly District 24, CA (442,181)
- Assembly District 23, CA (433,112)
- Assembly District 21, CA (432,366)
- Assembly District 27, CA (424,862)
Top 10 Neighboring 111th Congressional District (by Population) Neighboring 111th Congressional District on the Map
- Congressional District 22, CA (797,084)
- Congressional District 11, CA (796,753)
- Congressional District 20, CA (744,350)
- Congressional District 23, CA (695,404)
- Congressional District 24, CA (681,622)
- Congressional District 15, CA (677,605)
- Congressional District 16, CA (676,880)
- Congressional District 17, CA (664,240)
- Congressional District 14, CA (653,935)
Top 10 Neighboring Census Tract (by Population) Neighboring Census Tract on the Map
- Census Tract 24.02, Santa Barbara County, CA (11,406)
- Census Tract 103, San Luis Obispo County, CA (10,043)
- Census Tract 20.07, Santa Barbara County, CA (9,554)
- Census Tract 17.01, Kings County, CA (9,142)
- Census Tract 124.02, San Luis Obispo County, CA (9,097)
- Census Tract 123.04, San Luis Obispo County, CA (8,954)
- Census Tract 5033.34, Santa Clara County, CA (8,854)
- Census Tract 23.06, Santa Barbara County, CA (8,810)
- Census Tract 127.04, San Luis Obispo County, CA (8,650)
- Census Tract 1209, Santa Cruz County, CA (8,360)
Top 10 Neighboring 5-Digit ZIP Code Tabulation Area (by Population) Neighboring 5-Digit ZIP Code Tabulation Area on the Map
- 95076, CA (82,474)
- 95123, CA (62,228)
- 95127, CA (61,325)
- 95014, CA (60,717)
- 93906, CA (59,461)
- 95111, CA (58,466)
- 95020, CA (57,349)
- 93458, CA (55,431)
- 95124, CA (47,082)
- 95060, CA (46,377)
Data
Demographic, Population, Households, and Housing Units
** Data sources from census 2010 **
Show Data on Map
Download Full List as CSV
Download Quick Sheet as CSV
| Subject | This Area | California | National |
|---|---|---|---|
| POPULATION | |||
| Total Population Map | 903,066 | 37,253,956 | 308,745,538 |
| POPULATION, HISPANIC OR LATINO ORIGIN | |||
| Not Hispanic or Latino Map | 624,514 | 23,240,237 | 258,267,944 |
| Hispanic or Latino Map | 278,552 | 14,013,719 | 50,477,594 |
| POPULATION, RACE | |||
| White alone Map | 631,065 | 21,453,934 | 223,553,265 |
| Black or African American alone Map | 16,872 | 2,299,072 | 38,929,319 |
| American Indian and Alaska Native alone Map | 8,424 | 362,801 | 2,932,248 |
| Asian alone Map | 80,345 | 4,861,007 | 14,674,252 |
| Native Hawaiian and Other Pacific Islander alone Map | 2,537 | 144,386 | 540,013 |
| Some Other Race alone Map | 122,282 | 6,317,372 | 19,107,368 |
| Two or More Races Map | 41,541 | 1,815,384 | 9,009,073 |
| POPULATION, SEX | |||
| Male Map | 452,181 | 18,517,830 | 151,781,326 |
| Female Map | 450,885 | 18,736,126 | 156,964,212 |
| POPULATION, AGE (18 YEARS) | |||
| 18 years and over Map | 690,713 | 27,958,916 | 234,564,071 |
| Under 18 years | 212,353 | 9,295,040 | 74,181,467 |
| POPULATION, AGE | |||
| Under 5 years | 54,783 | 2,531,333 | 20,201,362 |
| 5 to 9 years | 58,445 | 2,505,839 | 20,348,657 |
| 10 to 14 years | 60,000 | 2,590,930 | 20,677,194 |
| 15 to 17 years | 39,125 | 1,666,938 | 12,954,254 |
| 18 and 19 years | 30,357 | 1,157,002 | 9,086,089 |
| 20 years | 15,166 | 573,642 | 4,519,129 |
| 21 years | 14,303 | 555,775 | 4,354,294 |
| 22 to 24 years | 36,798 | 1,636,532 | 12,712,576 |
| 25 to 29 years | 55,026 | 2,744,409 | 21,101,849 |
| 30 to 34 years | 49,821 | 2,573,468 | 19,962,099 |
| 35 to 39 years | 52,452 | 2,573,579 | 20,179,642 |
| 40 to 44 years | 58,657 | 2,609,131 | 20,890,964 |
| 45 to 49 years | 66,877 | 2,689,819 | 22,708,591 |
| 50 to 54 years | 68,216 | 2,562,552 | 22,298,125 |
| 55 to 59 years | 61,911 | 2,204,296 | 19,664,805 |
| 60 and 61 years | 22,606 | 786,276 | 7,113,727 |
| 62 to 64 years | 30,731 | 1,045,921 | 9,704,197 |
| 65 and 66 years | 16,767 | 568,817 | 5,319,902 |
| 67 to 69 years | 21,790 | 734,741 | 7,115,361 |
| 70 to 74 years | 28,283 | 971,778 | 9,278,166 |
| 75 to 79 years | 22,818 | 766,971 | 7,317,795 |
| 80 to 84 years | 18,887 | 603,239 | 5,743,327 |
| 85 years and over | 19,247 | 600,968 | 5,493,433 |
| MEDIAN AGE BY SEX | |||
| Both sexes Map | 38.70 | 35.20 | 37.20 |
| Male Map | 37.00 | 34.00 | 35.80 |
| Female Map | 40.30 | 36.30 | 38.50 |
| HOUSEHOLDS | |||
| Total Households Map | 316,399 | 12,577,498 | 116,716,292 |
| HOUSEHOLDS, HOUSEHOLD TYPE | |||
| Family households: Map | 218,908 | 8,642,473 | 77,538,296 |
| Husband-wife family Map | 173,145 | 6,213,310 | 56,510,377 |
| Other family: Map | 45,763 | 2,429,163 | 21,027,919 |
| Male householder, no wife present Map | 14,501 | 752,347 | 5,777,570 |
| Female householder, no husband present Map | 31,262 | 1,676,816 | 15,250,349 |
| Nonfamily households: Map | 97,491 | 3,935,025 | 39,177,996 |
| Householder living alone Map | 73,016 | 2,929,442 | 31,204,909 |
| Householder not living alone Map | 24,475 | 1,005,583 | 7,973,087 |
| HOUSEHOLDS, HISPANIC OR LATINO ORIGIN OF HOUSEHOLDER | |||
| Not Hispanic or Latino householder: Map | 252,319 | 9,192,322 | 103,254,926 |
| Hispanic or Latino householder: Map | 64,080 | 3,385,176 | 13,461,366 |
| HOUSEHOLDS, RACE OF HOUSEHOLDER | |||
| Householder who is White alone | 246,288 | 8,129,331 | 89,754,352 |
| Householder who is Black or African American alone | 5,142 | 835,651 | 14,129,983 |
| Householder who is American Indian and Alaska Native alone | 2,590 | 113,235 | 939,707 |
| Householder who is Asian alone | 24,921 | 1,529,789 | 4,632,164 |
| Householder who is Native Hawaiian and Other Pacific Islander alone | 744 | 38,238 | 143,932 |
| Householder who is Some Other Race alone | 27,220 | 1,497,993 | 4,916,427 |
| Householder who is Two or More Races | 9,494 | 433,261 | 2,199,727 |
| HOUSEHOLDS, HOUSEHOLD TYPE BY HOUSEHOLD SIZE | |||
| Family households: Map | 218,908 | 8,642,473 | 77,538,296 |
| 2-person household Map | 87,772 | 2,887,696 | 31,882,616 |
| 3-person household Map | 45,247 | 1,904,697 | 17,765,829 |
| 4-person household Map | 44,047 | 1,823,355 | 15,214,075 |
| 5-person household Map | 21,817 | 1,018,257 | 7,411,997 |
| 6-person household Map | 9,697 | 497,773 | 3,026,278 |
| 7-or-more-person household Map | 10,328 | 510,695 | 2,237,501 |
| Nonfamily households: Map | 97,491 | 3,935,025 | 39,177,996 |
| 1-person household Map | 73,016 | 2,929,442 | 31,204,909 |
| 2-person household Map | 18,000 | 766,106 | 6,360,012 |
| 3-person household Map | 3,537 | 139,115 | 992,156 |
| 4-person household Map | 1,779 | 60,096 | 411,171 |
| 5-person household Map | 696 | 22,151 | 126,634 |
| 6-person household Map | 267 | 9,698 | 48,421 |
| 7-or-more-person household Map | 196 | 8,417 | 34,693 |
| HOUSING UNITS | |||
| Total Housing Units Map | 350,261 | 13,680,081 | 131,704,730 |
| HOUSING UNITS, OCCUPANCY STATUS | |||
| Occupied Map | 316,399 | 12,577,498 | 116,716,292 |
| Vacant Map | 33,862 | 1,102,583 | 14,988,438 |
| HOUSING UNITS, OCCUPIED, TENURE | |||
| Owned with a mortgage or a loan Map | 146,301 | 5,465,345 | 52,979,430 |
| Owned free and clear Map | 52,392 | 1,570,026 | 23,006,644 |
| Renter occupied Map | 117,706 | 5,542,127 | 40,730,218 |
| HOUSING UNITS, VACANT, VACANCY STATUS | |||
| For rent Map | 5,950 | 374,610 | 4,137,567 |
| Rented, not occupied Map | 448 | 20,347 | 206,825 |
| For sale only Map | 3,554 | 154,775 | 1,896,796 |
| Sold, not occupied Map | 918 | 34,288 | 421,032 |
| For seasonal, recreational, or occasional use Map | 17,450 | 302,815 | 4,649,298 |
| For migrant workers Map | 168 | 2,100 | 24,161 |
| Other vacant Map | 5,374 | 213,648 | 3,652,759 |
| HOUSING UNITS, OCCUPIED, AVERAGE HOUSEHOLD SIZE BY TENURE | |||
| Total: Map | 2.77 | 2.90 | 2.58 |
| Owner occupied Map | 2.72 | 2.95 | 2.65 |
| Renter occupied Map | 2.84 | 2.83 | 2.44 |
| HOUSING UNITS, OCCUPIED, TENURE BY RACE OF HOUSEHOLDER | |||
| Owner occupied: Map | 198,693 | 7,035,371 | 75,986,074 |
| Householder who is White alone Map | 161,557 | 4,996,053 | 63,446,275 |
| Householder who is Black or African American alone Map | 2,225 | 310,834 | 6,261,464 |
| Householder who is American Indian and Alaska Native alone Map | 1,193 | 52,963 | 509,588 |
| Householder who is Asian alone Map | 18,866 | 878,924 | 2,688,861 |
| Householder who is Native Hawaiian and Other Pacific Islander alone Map | 342 | 16,570 | 61,911 |
| Householder who is Some Other Race alone Map | 9,982 | 589,196 | 1,975,817 |
| Householder who is Two or More Races Map | 4,528 | 190,831 | 1,042,158 |
| Renter occupied: Map | 117,706 | 5,542,127 | 40,730,218 |
| Householder who is White alone Map | 84,731 | 3,133,278 | 26,308,077 |
| Householder who is Black or African American alone Map | 2,917 | 524,817 | 7,868,519 |
| Householder who is American Indian and Alaska Native alone Map | 1,397 | 60,272 | 430,119 |
| Householder who is Asian alone Map | 6,055 | 650,865 | 1,943,303 |
| Householder who is Native Hawaiian and Other Pacific Islander alone Map | 402 | 21,668 | 82,021 |
| Householder who is Some Other Race alone Map | 17,238 | 908,797 | 2,940,610 |
| Householder who is Two or More Races Map | 4,966 | 242,430 | 1,157,569 |
| HOUSING UNITS, OCCUPIED, TENURE BY HISPANIC OR LATINO ORIGIN OF HOUSEHOLDER | |||
| Owner occupied: Map | 198,693 | 7,035,371 | 75,986,074 |
| Not Hispanic or Latino householder Map | 171,406 | 5,529,138 | 69,617,625 |
| Hispanic or Latino householder Map | 27,287 | 1,506,233 | 6,368,449 |
| Renter occupied: Map | 117,706 | 5,542,127 | 40,730,218 |
| Not Hispanic or Latino householder Map | 80,913 | 3,663,184 | 33,637,301 |
| Hispanic or Latino householder Map | 36,793 | 1,878,943 | 7,092,917 |
| HOUSING UNITS, OCCUPIED, TENURE BY HOUSEHOLD SIZE | |||
| Owner occupied: Map | 198,693 | 7,035,371 | 75,986,074 |
| 1-person household Map | 38,849 | 1,340,915 | 16,453,569 |
| 2-person household Map | 75,917 | 2,269,063 | 27,618,605 |
| 3-person household Map | 30,784 | 1,164,562 | 12,517,563 |
| 4-person household Map | 29,827 | 1,129,739 | 10,998,793 |
| 5-person household Map | 12,952 | 577,673 | 5,057,765 |
| 6-person household Map | 5,334 | 273,058 | 1,965,796 |
| 7-or-more-person household Map | 5,030 | 280,361 | 1,373,983 |
| Renter occupied: Map | 117,706 | 5,542,127 | 40,730,218 |
| 1-person household Map | 34,167 | 1,588,527 | 14,751,340 |
| 2-person household Map | 29,855 | 1,384,739 | 10,624,023 |
| 3-person household Map | 18,000 | 879,250 | 6,240,422 |
| 4-person household Map | 15,999 | 753,712 | 4,626,453 |
| 5-person household Map | 9,561 | 462,735 | 2,480,866 |
| 6-person household Map | 4,630 | 234,413 | 1,108,903 |
| 7-or-more-person household Map | 5,494 | 238,751 | 898,211 |
Loading...