


State Senate District 28, South Dakota
About
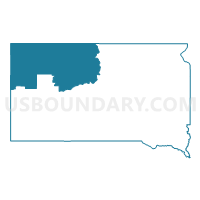
Outline

Summary
| Unique Area Identifier | 201423 |
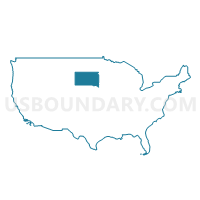
| Name | State Senate District 28 |
| State | South Dakota |
| Area (square miles) | 14,925.61 |
| Land Area (square miles) | 14,670.03 |
| Water Area (square miles) | 255.59 |
| % of Land Area | 98.29 |
| % of Water Area | 1.71 |
| Latitude of the Internal Point | 45.33227920 |
| Longtitude of the Internal Point | -102.19297400 |
| Total Population | 19,903 |
| Total Housing Units | 8,720 |
| Total Households | 7,112 |
| Median Age | 35.4 |
Maps
Graphs
Select a template below for downloading or customizing gragh for State Senate District 28, South Dakota


Neighbors
Neighoring State Legislative District Upper Chamber (by Name) Neighboring State Legislative District Upper Chamber on the Map
- State Senate District 1, WY
- State Senate District 20, MT
- State Senate District 23, SD
- State Senate District 24, SD
- State Senate District 27, SD
- State Senate District 28, ND
- State Senate District 29, SD
- State Senate District 31, SD
- State Senate District 31, ND
- State Senate District 39, ND
Top 10 Neighboring County (by Population) Neighboring County on the Map
- Meade County, SD (25,434)
- Lawrence County, SD (24,097)
- Butte County, SD (10,110)
- Crook County, WY (7,083)
- Walworth County, SD (5,438)
- Dewey County, SD (5,301)
- Sioux County, ND (4,153)
- Corson County, SD (4,050)
- Emmons County, ND (3,550)
- Bowman County, ND (3,151)
Top 10 Neighboring County Subdivision (by Population) Neighboring County Subdivision on the Map
- Southwest Meade UT, Meade County, SD (11,199)
- North Lawrence UT, Lawrence County, SD (5,792)
- Belle Fourche city, Butte County, SD (5,594)
- North Dewey UT, Dewey County, SD (3,228)
- West Butte UT, Butte County, SD (2,686)
- Sundance CCD, Crook County, WY (2,602)
- Baker CCD, Fallon County, MT (2,522)
- East Corson UT, Corson County, SD (2,284)
- Fort Yates UT, Sioux County, ND (2,239)
- Belle Fourche-Cheyenne Valleys UT, Meade County, SD (1,839)
Top 10 Neighboring Place (by Population) Neighboring Place on the Map
- Belle Fourche city, SD (5,594)
- North Eagle Butte CDP, SD (1,954)
- Eagle Butte city, SD (1,318)
- Lemmon city, SD (1,227)
- McLaughlin city, SD (663)
- Newell city, SD (603)
- Dupree city, SD (525)
- Timber Lake city, SD (443)
- Faith city, SD (421)
- Bullhead CDP, SD (348)
Top 10 Neighboring Elementary School District (by Population) Neighboring Elementary School District on the Map
- Ekalaka Elementary School District, MT (878)
- Bakker Public School District 10, ND (222)
- Alzada Elementary School District, MT (159)
Top 10 Neighboring Secondary School District (by Population) Neighboring Secondary School District on the Map
Top 10 Neighboring Unified School District (by Population) Neighboring Unified School District on the Map
- Meade School District 46-1, SD (18,211)
- Spearfish School District 40-2, SD (15,452)
- Belle Fourche School District 09-1, SD (7,962)
- Crook County School District 1, WY (7,083)
- Eagle Butte School District 20-1, SD (4,830)
- Mobridge-Pollock School District 62-6, SD (4,318)
- Stanley County School District 57-1, SD (2,966)
- Fort Yates Public School District 4, ND (2,727)
- Bowman County Public School District 1, ND (2,714)
- Baker K-12 Schools, MT (2,470)
Top 10 Neighboring State Legislative District Lower Chamber (by Population) Neighboring State Legislative District Lower Chamber on the Map
- State House District 29, SD (25,322)
- State House District 31, SD (24,097)
- State House District 27, SD (21,985)
- State House District 24, SD (21,361)
- State House District 23, SD (18,409)
- State House District 31, ND (13,907)
- State House District 39, ND (13,645)
- State House District 28, ND (12,109)
- State House District 28A, SD (10,018)
- State House District 28B, SD (9,885)
Top 10 Neighboring 111th Congressional District (by Population) Neighboring 111th Congressional District on the Map
- Congressional District (at Large), MT (989,415)
- Congressional District (at Large), SD (814,180)
- Congressional District (at Large), ND (672,591)
- Congressional District (at Large), WY (563,626)
Top 10 Neighboring Census Tract (by Population) Neighboring Census Tract on the Map
- Census Tract 9677, Butte County, SD (7,138)
- Census Tract 9661, Lawrence County, SD (5,957)
- Census Tract 203.02, Meade County, SD (5,519)
- Census Tract 9502, Crook County, WY (4,481)
- Census Tract 9663.01, Lawrence County, SD (4,433)
- Census Tract 205, Meade County, SD (4,380)
- Census Tract 9652, Walworth County, SD (3,771)
- Census Tract 9665, Emmons County, ND (3,550)
- Census Tract 9683, Perkins County, SD (2,982)
- Census Tract 9676, Butte County, SD (2,972)
Top 10 Neighboring 5-Digit ZIP Code Tabulation Area (by Population) Neighboring 5-Digit ZIP Code Tabulation Area on the Map
- 57501, SD (16,309)
- 57783, SD (14,290)
- 57785, SD (9,377)
- 57717, SD (8,007)
- 57625, SD (4,230)
- 57601, SD (4,003)
- 57532, SD (2,835)
- 59313, MT (2,498)
- 58538, ND (2,489)
- 58623, ND (2,370)
Data
Demographic, Population, Households, and Housing Units
** Data sources from census 2010 **
Show Data on Map
Download Full List as CSV
Download Quick Sheet as CSV
| Subject | This Area | South Dakota | National |
|---|---|---|---|
| POPULATION | |||
| Total Population Map | 19,903 | 814,180 | 308,745,538 |
| POPULATION, HISPANIC OR LATINO ORIGIN | |||
| Not Hispanic or Latino Map | 19,512 | 792,061 | 258,267,944 |
| Hispanic or Latino Map | 391 | 22,119 | 50,477,594 |
| POPULATION, RACE | |||
| White alone Map | 10,330 | 699,392 | 223,553,265 |
| Black or African American alone Map | 27 | 10,207 | 38,929,319 |
| American Indian and Alaska Native alone Map | 8,918 | 71,817 | 2,932,248 |
| Asian alone Map | 34 | 7,610 | 14,674,252 |
| Native Hawaiian and Other Pacific Islander alone Map | 7 | 394 | 540,013 |
| Some Other Race alone Map | 62 | 7,477 | 19,107,368 |
| Two or More Races Map | 525 | 17,283 | 9,009,073 |
| POPULATION, SEX | |||
| Male Map | 9,992 | 407,381 | 151,781,326 |
| Female Map | 9,911 | 406,799 | 156,964,212 |
| POPULATION, AGE (18 YEARS) | |||
| 18 years and over Map | 13,831 | 611,383 | 234,564,071 |
| Under 18 years | 6,072 | 202,797 | 74,181,467 |
| POPULATION, AGE | |||
| Under 5 years | 1,696 | 59,621 | 20,201,362 |
| 5 to 9 years | 1,650 | 55,531 | 20,348,657 |
| 10 to 14 years | 1,644 | 53,960 | 20,677,194 |
| 15 to 17 years | 1,082 | 33,685 | 12,954,254 |
| 18 and 19 years | 596 | 23,943 | 9,086,089 |
| 20 years | 200 | 11,907 | 4,519,129 |
| 21 years | 214 | 11,739 | 4,354,294 |
| 22 to 24 years | 601 | 33,950 | 12,712,576 |
| 25 to 29 years | 1,140 | 55,570 | 21,101,849 |
| 30 to 34 years | 1,036 | 49,859 | 19,962,099 |
| 35 to 39 years | 993 | 45,766 | 20,179,642 |
| 40 to 44 years | 1,180 | 47,346 | 20,890,964 |
| 45 to 49 years | 1,412 | 57,519 | 22,708,591 |
| 50 to 54 years | 1,492 | 59,399 | 22,298,125 |
| 55 to 59 years | 1,258 | 54,231 | 19,664,805 |
| 60 and 61 years | 419 | 18,999 | 7,113,727 |
| 62 to 64 years | 666 | 24,574 | 9,704,197 |
| 65 and 66 years | 347 | 13,621 | 5,319,902 |
| 67 to 69 years | 445 | 18,323 | 7,115,361 |
| 70 to 74 years | 633 | 25,683 | 9,278,166 |
| 75 to 79 years | 480 | 21,724 | 7,317,795 |
| 80 to 84 years | 356 | 18,004 | 5,743,327 |
| 85 years and over | 363 | 19,226 | 5,493,433 |
| MEDIAN AGE BY SEX | |||
| Both sexes Map | 35.40 | 36.90 | 37.20 |
| Male Map | 34.80 | 35.60 | 35.80 |
| Female Map | 36.10 | 38.20 | 38.50 |
| HOUSEHOLDS | |||
| Total Households Map | 7,112 | 322,282 | 116,716,292 |
| HOUSEHOLDS, HOUSEHOLD TYPE | |||
| Family households: Map | 5,030 | 206,964 | 77,538,296 |
| Husband-wife family Map | 3,396 | 161,617 | 56,510,377 |
| Other family: Map | 1,634 | 45,347 | 21,027,919 |
| Male householder, no wife present Map | 505 | 14,233 | 5,777,570 |
| Female householder, no husband present Map | 1,129 | 31,114 | 15,250,349 |
| Nonfamily households: Map | 2,082 | 115,318 | 39,177,996 |
| Householder living alone Map | 1,844 | 94,638 | 31,204,909 |
| Householder not living alone Map | 238 | 20,680 | 7,973,087 |
| HOUSEHOLDS, HISPANIC OR LATINO ORIGIN OF HOUSEHOLDER | |||
| Not Hispanic or Latino householder: Map | 7,038 | 316,719 | 103,254,926 |
| Hispanic or Latino householder: Map | 74 | 5,563 | 13,461,366 |
| HOUSEHOLDS, RACE OF HOUSEHOLDER | |||
| Householder who is White alone | 4,504 | 292,219 | 89,754,352 |
| Householder who is Black or African American alone | 7 | 3,029 | 14,129,983 |
| Householder who is American Indian and Alaska Native alone | 2,438 | 18,966 | 939,707 |
| Householder who is Asian alone | 12 | 2,199 | 4,632,164 |
| Householder who is Native Hawaiian and Other Pacific Islander alone | 1 | 111 | 143,932 |
| Householder who is Some Other Race alone | 22 | 2,014 | 4,916,427 |
| Householder who is Two or More Races | 128 | 3,744 | 2,199,727 |
| HOUSEHOLDS, HOUSEHOLD TYPE BY HOUSEHOLD SIZE | |||
| Family households: Map | 5,030 | 206,964 | 77,538,296 |
| 2-person household Map | 2,044 | 99,234 | 31,882,616 |
| 3-person household Map | 996 | 41,815 | 17,765,829 |
| 4-person household Map | 839 | 36,252 | 15,214,075 |
| 5-person household Map | 578 | 18,345 | 7,411,997 |
| 6-person household Map | 268 | 6,918 | 3,026,278 |
| 7-or-more-person household Map | 305 | 4,400 | 2,237,501 |
| Nonfamily households: Map | 2,082 | 115,318 | 39,177,996 |
| 1-person household Map | 1,844 | 94,638 | 31,204,909 |
| 2-person household Map | 216 | 16,441 | 6,360,012 |
| 3-person household Map | 15 | 2,758 | 992,156 |
| 4-person household Map | 4 | 1,019 | 411,171 |
| 5-person household Map | 1 | 303 | 126,634 |
| 6-person household Map | 1 | 95 | 48,421 |
| 7-or-more-person household Map | 1 | 64 | 34,693 |
| HOUSING UNITS | |||
| Total Housing Units Map | 8,720 | 363,438 | 131,704,730 |
| HOUSING UNITS, OCCUPANCY STATUS | |||
| Occupied Map | 7,112 | 322,282 | 116,716,292 |
| Vacant Map | 1,608 | 41,156 | 14,988,438 |
| HOUSING UNITS, OCCUPIED, TENURE | |||
| Owned with a mortgage or a loan Map | 1,714 | 133,814 | 52,979,430 |
| Owned free and clear Map | 2,981 | 85,744 | 23,006,644 |
| Renter occupied Map | 2,417 | 102,724 | 40,730,218 |
| HOUSING UNITS, VACANT, VACANCY STATUS | |||
| For rent Map | 281 | 10,366 | 4,137,567 |
| Rented, not occupied Map | 30 | 642 | 206,825 |
| For sale only Map | 63 | 3,696 | 1,896,796 |
| Sold, not occupied Map | 85 | 1,314 | 421,032 |
| For seasonal, recreational, or occasional use Map | 461 | 13,277 | 4,649,298 |
| For migrant workers Map | 9 | 88 | 24,161 |
| Other vacant Map | 679 | 11,773 | 3,652,759 |
| HOUSING UNITS, OCCUPIED, AVERAGE HOUSEHOLD SIZE BY TENURE | |||
| Total: Map | 2.78 | 2.42 | 2.58 |
| Owner occupied Map | 2.64 | 2.53 | 2.65 |
| Renter occupied Map | 3.07 | 2.18 | 2.44 |
| HOUSING UNITS, OCCUPIED, TENURE BY RACE OF HOUSEHOLDER | |||
| Owner occupied: Map | 4,695 | 219,558 | 75,986,074 |
| Householder who is White alone Map | 3,490 | 208,007 | 63,446,275 |
| Householder who is Black or African American alone Map | 1 | 747 | 6,261,464 |
| Householder who is American Indian and Alaska Native alone Map | 1,115 | 7,391 | 509,588 |
| Householder who is Asian alone Map | 8 | 958 | 2,688,861 |
| Householder who is Native Hawaiian and Other Pacific Islander alone Map | 0 | 50 | 61,911 |
| Householder who is Some Other Race alone Map | 9 | 753 | 1,975,817 |
| Householder who is Two or More Races Map | 72 | 1,652 | 1,042,158 |
| Renter occupied: Map | 2,417 | 102,724 | 40,730,218 |
| Householder who is White alone Map | 1,014 | 84,212 | 26,308,077 |
| Householder who is Black or African American alone Map | 6 | 2,282 | 7,868,519 |
| Householder who is American Indian and Alaska Native alone Map | 1,323 | 11,575 | 430,119 |
| Householder who is Asian alone Map | 4 | 1,241 | 1,943,303 |
| Householder who is Native Hawaiian and Other Pacific Islander alone Map | 1 | 61 | 82,021 |
| Householder who is Some Other Race alone Map | 13 | 1,261 | 2,940,610 |
| Householder who is Two or More Races Map | 56 | 2,092 | 1,157,569 |
| HOUSING UNITS, OCCUPIED, TENURE BY HISPANIC OR LATINO ORIGIN OF HOUSEHOLDER | |||
| Owner occupied: Map | 4,695 | 219,558 | 75,986,074 |
| Not Hispanic or Latino householder Map | 4,656 | 217,277 | 69,617,625 |
| Hispanic or Latino householder Map | 39 | 2,281 | 6,368,449 |
| Renter occupied: Map | 2,417 | 102,724 | 40,730,218 |
| Not Hispanic or Latino householder Map | 2,382 | 99,442 | 33,637,301 |
| Hispanic or Latino householder Map | 35 | 3,282 | 7,092,917 |
| HOUSING UNITS, OCCUPIED, TENURE BY HOUSEHOLD SIZE | |||
| Owner occupied: Map | 4,695 | 219,558 | 75,986,074 |
| 1-person household Map | 1,069 | 48,035 | 16,453,569 |
| 2-person household Map | 1,822 | 89,722 | 27,618,605 |
| 3-person household Map | 681 | 31,852 | 12,517,563 |
| 4-person household Map | 529 | 28,667 | 10,998,793 |
| 5-person household Map | 331 | 13,866 | 5,057,765 |
| 6-person household Map | 138 | 4,880 | 1,965,796 |
| 7-or-more-person household Map | 125 | 2,536 | 1,373,983 |
| Renter occupied: Map | 2,417 | 102,724 | 40,730,218 |
| 1-person household Map | 775 | 46,603 | 14,751,340 |
| 2-person household Map | 438 | 25,953 | 10,624,023 |
| 3-person household Map | 330 | 12,721 | 6,240,422 |
| 4-person household Map | 314 | 8,604 | 4,626,453 |
| 5-person household Map | 248 | 4,782 | 2,480,866 |
| 6-person household Map | 131 | 2,133 | 1,108,903 |
| 7-or-more-person household Map | 181 | 1,928 | 898,211 |
Loading...