


Carroll County School District, Georgia
About
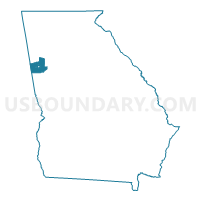
Outline

Summary
| Unique Area Identifier | 511534 |
| Name | Carroll County School District |
| State | Georgia |
| Area (square miles) | 478.75 |
| Land Area (square miles) | 474.56 |
| Water Area (square miles) | 4.20 |
| % of Land Area | 99.12 |
| % of Water Area | 0.88 |
| Latitude of the Internal Point | 33.61867320 |
| Longtitude of the Internal Point | -85.07387180 |
| Total Population | 86,094 |
| Total Housing Units | 34,857 |
| Total Households | 30,774 |
| Median Age | 36 |
Maps
Graphs
Select a template below for downloading or customizing gragh for Carroll County School District, Georgia


Neighbors
Neighoring Unified School District (by Name) Neighboring Unified School District on the Map
- Bremen City School District, GA
- Carrollton City School District, GA
- Cleburne County School District, AL
- Coweta County School District, GA
- Douglas County School District, GA
- Fulton County School District, GA
- Haralson County School District, GA
- Heard County School District, GA
- Paulding County School District, GA
- Randolph County School District, AL
Top 10 Neighboring County (by Population) Neighboring County on the Map
- Fulton County, GA (920,581)
- Paulding County, GA (142,324)
- Douglas County, GA (132,403)
- Coweta County, GA (127,317)
- Carroll County, GA (110,527)
- Haralson County, GA (28,780)
- Randolph County, AL (22,913)
- Cleburne County, AL (14,972)
- Heard County, GA (11,834)
Top 10 Neighboring County Subdivision (by Population) Neighboring County Subdivision on the Map
- Newnan CCD, Coweta County, GA (99,028)
- Carrollton CCD, Carroll County, GA (55,393)
- Villa Rica CCD, Carroll County, GA (20,222)
- Yorkville CCD, Paulding County, GA (17,016)
- Bremen CCD, Haralson County, GA (12,999)
- Winston CCD, Douglas County, GA (12,560)
- Temple CCD, Carroll County, GA (11,728)
- Bowdon CCD, Carroll County, GA (9,009)
- Fairplay CCD, Douglas County, GA (8,607)
- Tallapoosa CCD, Haralson County, GA (8,189)
Top 10 Neighboring Place (by Population) Neighboring Place on the Map
- Carrollton city, GA (24,388)
- Villa Rica city, GA (13,956)
- Bremen city, GA (6,227)
- Temple city, GA (4,228)
- Chattahoochee Hills city, GA (2,378)
- Bowdon city, GA (2,040)
- Mount Zion city, GA (1,696)
- Whitesburg city, GA (588)
- Ephesus city, GA (427)
- Ranburne town, AL (409)
Top 10 Neighboring State Legislative District Lower Chamber (by Population) Neighboring State Legislative District Lower Chamber on the Map
- State House District 17, GA (79,395)
- State House District 65, GA (75,570)
- State House District 70, GA (69,309)
- State House District 68, GA (65,624)
- State House District 67, GA (63,519)
- State House District 71, GA (59,721)
- State House District 18, GA (52,188)
- State House District 69, GA (51,692)
- State House District 39, AL (46,905)
- State House District 37, AL (43,958)
Top 10 Neighboring State Legislative District Upper Chamber (by Population) Neighboring State Legislative District Upper Chamber on the Map
- State Senate District 35, GA (214,483)
- State Senate District 30, GA (212,492)
- State Senate District 31, GA (204,694)
- State Senate District 28, GA (191,899)
- State Senate District 13, AL (132,777)
Top 10 Neighboring 111th Congressional District (by Population) Neighboring 111th Congressional District on the Map
- Congressional District 3, GA (817,247)
- Congressional District 11, GA (794,969)
- Congressional District 13, GA (784,445)
- Congressional District 3, AL (681,298)
Top 10 Neighboring Census Tract (by Population) Neighboring Census Tract on the Map
- Census Tract 1204, Paulding County, GA (17,016)
- Census Tract 9102, Carroll County, GA (11,728)
- Census Tract 9101.04, Carroll County, GA (9,273)
- Census Tract 9107.01, Carroll County, GA (9,171)
- Census Tract 9105.01, Carroll County, GA (8,876)
- Census Tract 804.02, Douglas County, GA (8,607)
- Census Tract 9107.03, Carroll County, GA (7,972)
- Census Tract 804.04, Douglas County, GA (7,943)
- Census Tract 104, Haralson County, GA (7,804)
- Census Tract 9107.02, Carroll County, GA (7,738)
Top 10 Neighboring 5-Digit ZIP Code Tabulation Area (by Population) Neighboring 5-Digit ZIP Code Tabulation Area on the Map
- 30135, GA (61,912)
- 30263, GA (53,008)
- 30117, GA (34,296)
- 30180, GA (34,274)
- 30116, GA (23,156)
- 30179, GA (16,807)
- 30110, GA (13,349)
- 30217, GA (9,433)
- 30268, GA (9,090)
- 30187, GA (8,740)
Data
Demographic, Population, Households, and Housing Units
** Data sources from census 2010 **
Show Data on Map
Download Full List as CSV
Download Quick Sheet as CSV
| Subject | This Area | Georgia | National |
|---|---|---|---|
| POPULATION | |||
| Total Population Map | 86,094 | 9,687,653 | 308,745,538 |
| POPULATION, HISPANIC OR LATINO ORIGIN | |||
| Not Hispanic or Latino Map | 81,927 | 8,833,964 | 258,267,944 |
| Hispanic or Latino Map | 4,167 | 853,689 | 50,477,594 |
| POPULATION, RACE | |||
| White alone Map | 69,287 | 5,787,440 | 223,553,265 |
| Black or African American alone Map | 12,316 | 2,950,435 | 38,929,319 |
| American Indian and Alaska Native alone Map | 287 | 32,151 | 2,932,248 |
| Asian alone Map | 507 | 314,467 | 14,674,252 |
| Native Hawaiian and Other Pacific Islander alone Map | 23 | 6,799 | 540,013 |
| Some Other Race alone Map | 1,888 | 388,872 | 19,107,368 |
| Two or More Races Map | 1,786 | 207,489 | 9,009,073 |
| POPULATION, SEX | |||
| Male Map | 42,192 | 4,729,171 | 151,781,326 |
| Female Map | 43,902 | 4,958,482 | 156,964,212 |
| POPULATION, AGE (18 YEARS) | |||
| 18 years and over Map | 62,963 | 7,196,101 | 234,564,071 |
| Under 18 years | 23,131 | 2,491,552 | 74,181,467 |
| POPULATION, AGE | |||
| Under 5 years | 6,196 | 686,785 | 20,201,362 |
| 5 to 9 years | 6,504 | 695,161 | 20,348,657 |
| 10 to 14 years | 6,559 | 689,684 | 20,677,194 |
| 15 to 17 years | 3,872 | 419,922 | 12,954,254 |
| 18 and 19 years | 2,258 | 290,077 | 9,086,089 |
| 20 years | 1,036 | 143,471 | 4,519,129 |
| 21 years | 1,052 | 137,251 | 4,354,294 |
| 22 to 24 years | 3,194 | 399,358 | 12,712,576 |
| 25 to 29 years | 5,539 | 673,935 | 21,101,849 |
| 30 to 34 years | 5,732 | 661,625 | 19,962,099 |
| 35 to 39 years | 6,000 | 698,059 | 20,179,642 |
| 40 to 44 years | 6,139 | 699,481 | 20,890,964 |
| 45 to 49 years | 6,376 | 722,661 | 22,708,591 |
| 50 to 54 years | 5,992 | 668,591 | 22,298,125 |
| 55 to 59 years | 5,259 | 573,551 | 19,664,805 |
| 60 and 61 years | 1,970 | 209,870 | 7,113,727 |
| 62 to 64 years | 2,732 | 286,136 | 9,704,197 |
| 65 and 66 years | 1,520 | 154,645 | 5,319,902 |
| 67 to 69 years | 1,949 | 201,362 | 7,115,361 |
| 70 to 74 years | 2,537 | 250,422 | 9,278,166 |
| 75 to 79 years | 1,723 | 182,735 | 7,317,795 |
| 80 to 84 years | 1,085 | 129,048 | 5,743,327 |
| 85 years and over | 870 | 113,823 | 5,493,433 |
| MEDIAN AGE BY SEX | |||
| Both sexes Map | 36.00 | 35.30 | 37.20 |
| Male Map | 35.10 | 34.10 | 35.80 |
| Female Map | 36.90 | 36.50 | 38.50 |
| HOUSEHOLDS | |||
| Total Households Map | 30,774 | 3,585,584 | 116,716,292 |
| HOUSEHOLDS, HOUSEHOLD TYPE | |||
| Family households: Map | 23,323 | 2,457,810 | 77,538,296 |
| Husband-wife family Map | 17,541 | 1,714,573 | 56,510,377 |
| Other family: Map | 5,782 | 743,237 | 21,027,919 |
| Male householder, no wife present Map | 1,652 | 175,090 | 5,777,570 |
| Female householder, no husband present Map | 4,130 | 568,147 | 15,250,349 |
| Nonfamily households: Map | 7,451 | 1,127,774 | 39,177,996 |
| Householder living alone Map | 5,981 | 909,474 | 31,204,909 |
| Householder not living alone Map | 1,470 | 218,300 | 7,973,087 |
| HOUSEHOLDS, HISPANIC OR LATINO ORIGIN OF HOUSEHOLDER | |||
| Not Hispanic or Latino householder: Map | 29,818 | 3,377,850 | 103,254,926 |
| Hispanic or Latino householder: Map | 956 | 207,734 | 13,461,366 |
| HOUSEHOLDS, RACE OF HOUSEHOLDER | |||
| Householder who is White alone | 25,628 | 2,270,546 | 89,754,352 |
| Householder who is Black or African American alone | 4,196 | 1,064,711 | 14,129,983 |
| Householder who is American Indian and Alaska Native alone | 111 | 10,909 | 939,707 |
| Householder who is Asian alone | 126 | 95,786 | 4,632,164 |
| Householder who is Native Hawaiian and Other Pacific Islander alone | 8 | 1,961 | 143,932 |
| Householder who is Some Other Race alone | 389 | 91,232 | 4,916,427 |
| Householder who is Two or More Races | 316 | 50,439 | 2,199,727 |
| HOUSEHOLDS, HOUSEHOLD TYPE BY HOUSEHOLD SIZE | |||
| Family households: Map | 23,323 | 2,457,810 | 77,538,296 |
| 2-person household Map | 9,039 | 957,729 | 31,882,616 |
| 3-person household Map | 5,494 | 592,787 | 17,765,829 |
| 4-person household Map | 4,849 | 503,595 | 15,214,075 |
| 5-person household Map | 2,377 | 240,456 | 7,411,997 |
| 6-person household Map | 920 | 96,811 | 3,026,278 |
| 7-or-more-person household Map | 644 | 66,432 | 2,237,501 |
| Nonfamily households: Map | 7,451 | 1,127,774 | 39,177,996 |
| 1-person household Map | 5,981 | 909,474 | 31,204,909 |
| 2-person household Map | 1,133 | 172,409 | 6,360,012 |
| 3-person household Map | 207 | 28,107 | 992,156 |
| 4-person household Map | 96 | 11,923 | 411,171 |
| 5-person household Map | 23 | 3,619 | 126,634 |
| 6-person household Map | 8 | 1,309 | 48,421 |
| 7-or-more-person household Map | 3 | 933 | 34,693 |
| HOUSING UNITS | |||
| Total Housing Units Map | 34,857 | 4,088,801 | 131,704,730 |
| HOUSING UNITS, OCCUPANCY STATUS | |||
| Occupied Map | 30,774 | 3,585,584 | 116,716,292 |
| Vacant Map | 4,083 | 503,217 | 14,988,438 |
| HOUSING UNITS, OCCUPIED, TENURE | |||
| Owned with a mortgage or a loan Map | 16,808 | 1,751,631 | 52,979,430 |
| Owned free and clear Map | 6,223 | 602,771 | 23,006,644 |
| Renter occupied Map | 7,743 | 1,231,182 | 40,730,218 |
| HOUSING UNITS, VACANT, VACANCY STATUS | |||
| For rent Map | 1,168 | 174,416 | 4,137,567 |
| Rented, not occupied Map | 49 | 6,792 | 206,825 |
| For sale only Map | 866 | 83,852 | 1,896,796 |
| Sold, not occupied Map | 143 | 13,118 | 421,032 |
| For seasonal, recreational, or occasional use Map | 321 | 81,511 | 4,649,298 |
| For migrant workers Map | 0 | 854 | 24,161 |
| Other vacant Map | 1,536 | 142,674 | 3,652,759 |
| HOUSING UNITS, OCCUPIED, AVERAGE HOUSEHOLD SIZE BY TENURE | |||
| Total: Map | 2.79 | 2.63 | 2.58 |
| Owner occupied Map | 2.75 | 2.67 | 2.65 |
| Renter occupied Map | 2.90 | 2.56 | 2.44 |
| HOUSING UNITS, OCCUPIED, TENURE BY RACE OF HOUSEHOLDER | |||
| Owner occupied: Map | 23,031 | 2,354,402 | 75,986,074 |
| Householder who is White alone Map | 19,883 | 1,691,212 | 63,446,275 |
| Householder who is Black or African American alone Map | 2,597 | 534,727 | 6,261,464 |
| Householder who is American Indian and Alaska Native alone Map | 72 | 5,889 | 509,588 |
| Householder who is Asian alone Map | 89 | 61,567 | 2,688,861 |
| Householder who is Native Hawaiian and Other Pacific Islander alone Map | 3 | 899 | 61,911 |
| Householder who is Some Other Race alone Map | 188 | 34,688 | 1,975,817 |
| Householder who is Two or More Races Map | 199 | 25,420 | 1,042,158 |
| Renter occupied: Map | 7,743 | 1,231,182 | 40,730,218 |
| Householder who is White alone Map | 5,745 | 579,334 | 26,308,077 |
| Householder who is Black or African American alone Map | 1,599 | 529,984 | 7,868,519 |
| Householder who is American Indian and Alaska Native alone Map | 39 | 5,020 | 430,119 |
| Householder who is Asian alone Map | 37 | 34,219 | 1,943,303 |
| Householder who is Native Hawaiian and Other Pacific Islander alone Map | 5 | 1,062 | 82,021 |
| Householder who is Some Other Race alone Map | 201 | 56,544 | 2,940,610 |
| Householder who is Two or More Races Map | 117 | 25,019 | 1,157,569 |
| HOUSING UNITS, OCCUPIED, TENURE BY HISPANIC OR LATINO ORIGIN OF HOUSEHOLDER | |||
| Owner occupied: Map | 23,031 | 2,354,402 | 75,986,074 |
| Not Hispanic or Latino householder Map | 22,491 | 2,262,073 | 69,617,625 |
| Hispanic or Latino householder Map | 540 | 92,329 | 6,368,449 |
| Renter occupied: Map | 7,743 | 1,231,182 | 40,730,218 |
| Not Hispanic or Latino householder Map | 7,327 | 1,115,777 | 33,637,301 |
| Hispanic or Latino householder Map | 416 | 115,405 | 7,092,917 |
| HOUSING UNITS, OCCUPIED, TENURE BY HOUSEHOLD SIZE | |||
| Owner occupied: Map | 23,031 | 2,354,402 | 75,986,074 |
| 1-person household Map | 4,127 | 498,417 | 16,453,569 |
| 2-person household Map | 8,297 | 821,066 | 27,618,605 |
| 3-person household Map | 4,233 | 417,477 | 12,517,563 |
| 4-person household Map | 3,686 | 360,504 | 10,998,793 |
| 5-person household Map | 1,636 | 159,076 | 5,057,765 |
| 6-person household Map | 632 | 60,144 | 1,965,796 |
| 7-or-more-person household Map | 420 | 37,718 | 1,373,983 |
| Renter occupied: Map | 7,743 | 1,231,182 | 40,730,218 |
| 1-person household Map | 1,854 | 411,057 | 14,751,340 |
| 2-person household Map | 1,875 | 309,072 | 10,624,023 |
| 3-person household Map | 1,468 | 203,417 | 6,240,422 |
| 4-person household Map | 1,259 | 155,014 | 4,626,453 |
| 5-person household Map | 764 | 84,999 | 2,480,866 |
| 6-person household Map | 296 | 37,976 | 1,108,903 |
| 7-or-more-person household Map | 227 | 29,647 | 898,211 |
Loading...