


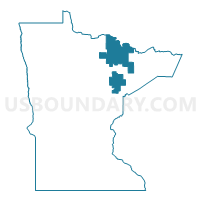
St. Louis County School District, Minnesota
About
Outline

Summary
| Unique Area Identifier | 514564 |
| Name | St. Louis County School District |
| State | Minnesota |
| Area (square miles) | 4,205.80 |
| Land Area (square miles) | 3,846.83 |
| Water Area (square miles) | 358.97 |
| % of Land Area | 91.46 |
| % of Water Area | 8.54 |
| Latitude of the Internal Point | 47.78879790 |
| Longtitude of the Internal Point | -92.52573000 |
| Total Population | 17,844 |
| Total Housing Units | 15,117 |
| Total Households | 7,813 |
| Median Age | 48.8 |
Maps
Graphs
Select a template below for downloading or customizing gragh for St. Louis County School District, Minnesota


Neighbors
Neighoring Unified School District (by Name) Neighboring Unified School District on the Map
- Chisholm Public School District, MN
- Cloquet Public School District, MN
- Cromwell-Wright Public Schools, MN
- Duluth Public School District, MN
- Ely Public School District, MN
- Eveleth-Gilbert School District, MN
- Floodwood Public School District, MN
- Grand Rapids Public School District, MN
- Hermantown Public School District, MN
- Hibbing Public School District, MN
- International Falls Public School District, MN
- Lake Superior Public School District, MN
- Littlefork-Big Falls School District, MN
- Mesabi East School District, MN
- Mountain Iron-Buhl School District, MN
- Nett Lake Public School District, MN
- Proctor Public School District, MN
- South Koochiching School District, MN
- Virginia Public School District, MN
Top 10 Neighboring County (by Population) Neighboring County on the Map
- St. Louis County, MN (200,226)
- Itasca County, MN (45,058)
- Carlton County, MN (35,386)
- Koochiching County, MN (13,311)
- Lake County, MN (10,866)
Top 10 Neighboring County Subdivision (by Population) Neighboring County Subdivision on the Map
- Hibbing city, St. Louis County, MN (16,361)
- Cloquet city, Carlton County, MN (12,124)
- Rainy Lake UT, Koochiching County, MN (4,048)
- White township, St. Louis County, MN (3,229)
- Mountain Iron city, St. Louis County, MN (2,869)
- Grand Lake township, St. Louis County, MN (2,779)
- Lake No. 2 UT, Lake County, MN (2,094)
- Hoyt Lakes city, St. Louis County, MN (2,017)
- Solway township, St. Louis County, MN (1,944)
- Fayal township, St. Louis County, MN (1,809)
Top 10 Neighboring Place (by Population) Neighboring Place on the Map
- Hibbing city, MN (16,361)
- Cloquet city, MN (12,124)
- Mountain Iron city, MN (2,869)
- Hoyt Lakes city, MN (2,017)
- Babbitt city, MN (1,475)
- Cook city, MN (574)
- Tower city, MN (500)
- Soudan CDP, MN (446)
- Orr city, MN (267)
- Mahnomen CDP, MN (239)
Top 10 Neighboring State Legislative District Lower Chamber (by Population) Neighboring State Legislative District Lower Chamber on the Map
- State House District 8A, MN (40,616)
- State House District 6A, MN (36,396)
- State House District 5B, MN (36,304)
- State House District 3A, MN (35,316)
- State House District 5A, MN (34,921)
Top 10 Neighboring State Legislative District Upper Chamber (by Population) Neighboring State Legislative District Upper Chamber on the Map
- State Senate District 8, MN (81,987)
- State Senate District 6, MN (76,702)
- State Senate District 3, MN (73,721)
- State Senate District 5, MN (71,225)
Top 10 Neighboring 111th Congressional District (by Population) Neighboring 111th Congressional District on the Map
Top 10 Neighboring Census Tract (by Population) Neighboring Census Tract on the Map
- Census Tract 111, St. Louis County, MN (7,009)
- Census Tract 106, St. Louis County, MN (6,198)
- Census Tract 121, St. Louis County, MN (4,837)
- Census Tract 3701, Lake County, MN (4,471)
- Census Tract 4804, Itasca County, MN (3,594)
- Census Tract 152, St. Louis County, MN (3,521)
- Census Tract 155, St. Louis County, MN (3,441)
- Census Tract 154, St. Louis County, MN (3,422)
- Census Tract 706, Carlton County, MN (3,382)
- Census Tract 112, St. Louis County, MN (3,315)
Top 10 Neighboring 5-Digit ZIP Code Tabulation Area (by Population) Neighboring 5-Digit ZIP Code Tabulation Area on the Map
- 55803, MN (17,431)
- 55746, MN (17,228)
- 55720, MN (16,999)
- 55792, MN (10,107)
- 56649, MN (9,932)
- 55616, MN (6,994)
- 55734, MN (6,213)
- 55719, MN (5,895)
- 55731, MN (5,820)
- 55779, MN (3,755)
Data
Demographic, Population, Households, and Housing Units
** Data sources from census 2010 **
Show Data on Map
Download Full List as CSV
Download Quick Sheet as CSV
| Subject | This Area | Minnesota | National |
|---|---|---|---|
| POPULATION | |||
| Total Population Map | 17,844 | 5,303,925 | 308,745,538 |
| POPULATION, HISPANIC OR LATINO ORIGIN | |||
| Not Hispanic or Latino Map | 17,726 | 5,053,667 | 258,267,944 |
| Hispanic or Latino Map | 118 | 250,258 | 50,477,594 |
| POPULATION, RACE | |||
| White alone Map | 16,443 | 4,524,062 | 223,553,265 |
| Black or African American alone Map | 51 | 274,412 | 38,929,319 |
| American Indian and Alaska Native alone Map | 954 | 60,916 | 2,932,248 |
| Asian alone Map | 53 | 214,234 | 14,674,252 |
| Native Hawaiian and Other Pacific Islander alone Map | 14 | 2,156 | 540,013 |
| Some Other Race alone Map | 16 | 103,000 | 19,107,368 |
| Two or More Races Map | 313 | 125,145 | 9,009,073 |
| POPULATION, SEX | |||
| Male Map | 9,353 | 2,632,132 | 151,781,326 |
| Female Map | 8,491 | 2,671,793 | 156,964,212 |
| POPULATION, AGE (18 YEARS) | |||
| 18 years and over Map | 14,446 | 4,019,862 | 234,564,071 |
| Under 18 years | 3,398 | 1,284,063 | 74,181,467 |
| POPULATION, AGE | |||
| Under 5 years | 825 | 355,504 | 20,201,362 |
| 5 to 9 years | 928 | 355,536 | 20,348,657 |
| 10 to 14 years | 979 | 352,342 | 20,677,194 |
| 15 to 17 years | 666 | 220,681 | 12,954,254 |
| 18 and 19 years | 332 | 147,148 | 9,086,089 |
| 20 years | 138 | 72,732 | 4,519,129 |
| 21 years | 127 | 70,594 | 4,354,294 |
| 22 to 24 years | 352 | 212,325 | 12,712,576 |
| 25 to 29 years | 745 | 372,686 | 21,101,849 |
| 30 to 34 years | 818 | 342,900 | 19,962,099 |
| 35 to 39 years | 891 | 328,190 | 20,179,642 |
| 40 to 44 years | 1,078 | 352,904 | 20,890,964 |
| 45 to 49 years | 1,439 | 406,203 | 22,708,591 |
| 50 to 54 years | 1,772 | 401,695 | 22,298,125 |
| 55 to 59 years | 1,797 | 349,589 | 19,664,805 |
| 60 and 61 years | 613 | 120,761 | 7,113,727 |
| 62 to 64 years | 833 | 159,014 | 9,704,197 |
| 65 and 66 years | 475 | 86,158 | 5,319,902 |
| 67 to 69 years | 686 | 116,412 | 7,115,361 |
| 70 to 74 years | 963 | 151,857 | 9,278,166 |
| 75 to 79 years | 641 | 122,114 | 7,317,795 |
| 80 to 84 years | 429 | 99,916 | 5,743,327 |
| 85 years and over | 317 | 106,664 | 5,493,433 |
| MEDIAN AGE BY SEX | |||
| Both sexes Map | 48.80 | 37.40 | 37.20 |
| Male Map | 48.60 | 36.30 | 35.80 |
| Female Map | 49.10 | 38.40 | 38.50 |
| HOUSEHOLDS | |||
| Total Households Map | 7,813 | 2,087,227 | 116,716,292 |
| HOUSEHOLDS, HOUSEHOLD TYPE | |||
| Family households: Map | 5,200 | 1,349,015 | 77,538,296 |
| Husband-wife family Map | 4,339 | 1,060,509 | 56,510,377 |
| Other family: Map | 861 | 288,506 | 21,027,919 |
| Male householder, no wife present Map | 358 | 89,707 | 5,777,570 |
| Female householder, no husband present Map | 503 | 198,799 | 15,250,349 |
| Nonfamily households: Map | 2,613 | 738,212 | 39,177,996 |
| Householder living alone Map | 2,220 | 584,008 | 31,204,909 |
| Householder not living alone Map | 393 | 154,204 | 7,973,087 |
| HOUSEHOLDS, HISPANIC OR LATINO ORIGIN OF HOUSEHOLDER | |||
| Not Hispanic or Latino householder: Map | 7,783 | 2,027,489 | 103,254,926 |
| Hispanic or Latino householder: Map | 30 | 59,738 | 13,461,366 |
| HOUSEHOLDS, RACE OF HOUSEHOLDER | |||
| Householder who is White alone | 7,393 | 1,870,205 | 89,754,352 |
| Householder who is Black or African American alone | 7 | 90,187 | 14,129,983 |
| Householder who is American Indian and Alaska Native alone | 321 | 19,078 | 939,707 |
| Householder who is Asian alone | 14 | 57,475 | 4,632,164 |
| Householder who is Native Hawaiian and Other Pacific Islander alone | 2 | 603 | 143,932 |
| Householder who is Some Other Race alone | 4 | 24,853 | 4,916,427 |
| Householder who is Two or More Races | 72 | 24,826 | 2,199,727 |
| HOUSEHOLDS, HOUSEHOLD TYPE BY HOUSEHOLD SIZE | |||
| Family households: Map | 5,200 | 1,349,015 | 77,538,296 |
| 2-person household Map | 3,056 | 602,770 | 31,882,616 |
| 3-person household Map | 883 | 289,028 | 17,765,829 |
| 4-person household Map | 743 | 265,265 | 15,214,075 |
| 5-person household Map | 342 | 119,947 | 7,411,997 |
| 6-person household Map | 108 | 43,372 | 3,026,278 |
| 7-or-more-person household Map | 68 | 28,633 | 2,237,501 |
| Nonfamily households: Map | 2,613 | 738,212 | 39,177,996 |
| 1-person household Map | 2,220 | 584,008 | 31,204,909 |
| 2-person household Map | 351 | 121,616 | 6,360,012 |
| 3-person household Map | 23 | 18,766 | 992,156 |
| 4-person household Map | 14 | 9,356 | 411,171 |
| 5-person household Map | 2 | 3,055 | 126,634 |
| 6-person household Map | 2 | 886 | 48,421 |
| 7-or-more-person household Map | 1 | 525 | 34,693 |
| HOUSING UNITS | |||
| Total Housing Units Map | 15,117 | 2,347,201 | 131,704,730 |
| HOUSING UNITS, OCCUPANCY STATUS | |||
| Occupied Map | 7,813 | 2,087,227 | 116,716,292 |
| Vacant Map | 7,304 | 259,974 | 14,988,438 |
| HOUSING UNITS, OCCUPIED, TENURE | |||
| Owned with a mortgage or a loan Map | 3,707 | 1,109,405 | 52,979,430 |
| Owned free and clear Map | 3,207 | 414,454 | 23,006,644 |
| Renter occupied Map | 899 | 563,368 | 40,730,218 |
| HOUSING UNITS, VACANT, VACANCY STATUS | |||
| For rent Map | 99 | 48,091 | 4,137,567 |
| Rented, not occupied Map | 9 | 3,198 | 206,825 |
| For sale only Map | 167 | 30,726 | 1,896,796 |
| Sold, not occupied Map | 25 | 6,232 | 421,032 |
| For seasonal, recreational, or occasional use Map | 6,606 | 130,471 | 4,649,298 |
| For migrant workers Map | 0 | 334 | 24,161 |
| Other vacant Map | 398 | 40,922 | 3,652,759 |
| HOUSING UNITS, OCCUPIED, AVERAGE HOUSEHOLD SIZE BY TENURE | |||
| Total: Map | 2.27 | 2.48 | 2.58 |
| Owner occupied Map | 2.29 | 2.59 | 2.65 |
| Renter occupied Map | 2.10 | 2.16 | 2.44 |
| HOUSING UNITS, OCCUPIED, TENURE BY RACE OF HOUSEHOLDER | |||
| Owner occupied: Map | 6,914 | 1,523,859 | 75,986,074 |
| Householder who is White alone Map | 6,641 | 1,437,173 | 63,446,275 |
| Householder who is Black or African American alone Map | 3 | 22,968 | 6,261,464 |
| Householder who is American Indian and Alaska Native alone Map | 198 | 9,155 | 509,588 |
| Householder who is Asian alone Map | 10 | 32,562 | 2,688,861 |
| Householder who is Native Hawaiian and Other Pacific Islander alone Map | 1 | 308 | 61,911 |
| Householder who is Some Other Race alone Map | 2 | 9,816 | 1,975,817 |
| Householder who is Two or More Races Map | 59 | 11,877 | 1,042,158 |
| Renter occupied: Map | 899 | 563,368 | 40,730,218 |
| Householder who is White alone Map | 752 | 433,032 | 26,308,077 |
| Householder who is Black or African American alone Map | 4 | 67,219 | 7,868,519 |
| Householder who is American Indian and Alaska Native alone Map | 123 | 9,923 | 430,119 |
| Householder who is Asian alone Map | 4 | 24,913 | 1,943,303 |
| Householder who is Native Hawaiian and Other Pacific Islander alone Map | 1 | 295 | 82,021 |
| Householder who is Some Other Race alone Map | 2 | 15,037 | 2,940,610 |
| Householder who is Two or More Races Map | 13 | 12,949 | 1,157,569 |
| HOUSING UNITS, OCCUPIED, TENURE BY HISPANIC OR LATINO ORIGIN OF HOUSEHOLDER | |||
| Owner occupied: Map | 6,914 | 1,523,859 | 75,986,074 |
| Not Hispanic or Latino householder Map | 6,890 | 1,497,368 | 69,617,625 |
| Hispanic or Latino householder Map | 24 | 26,491 | 6,368,449 |
| Renter occupied: Map | 899 | 563,368 | 40,730,218 |
| Not Hispanic or Latino householder Map | 893 | 530,121 | 33,637,301 |
| Hispanic or Latino householder Map | 6 | 33,247 | 7,092,917 |
| HOUSING UNITS, OCCUPIED, TENURE BY HOUSEHOLD SIZE | |||
| Owner occupied: Map | 6,914 | 1,523,859 | 75,986,074 |
| 1-person household Map | 1,794 | 329,955 | 16,453,569 |
| 2-person household Map | 3,182 | 581,481 | 27,618,605 |
| 3-person household Map | 807 | 236,596 | 12,517,563 |
| 4-person household Map | 674 | 224,564 | 10,998,793 |
| 5-person household Map | 301 | 98,018 | 5,057,765 |
| 6-person household Map | 101 | 33,229 | 1,965,796 |
| 7-or-more-person household Map | 55 | 20,016 | 1,373,983 |
| Renter occupied: Map | 899 | 563,368 | 40,730,218 |
| 1-person household Map | 426 | 254,053 | 14,751,340 |
| 2-person household Map | 225 | 142,905 | 10,624,023 |
| 3-person household Map | 99 | 71,198 | 6,240,422 |
| 4-person household Map | 83 | 50,057 | 4,626,453 |
| 5-person household Map | 43 | 24,984 | 2,480,866 |
| 6-person household Map | 9 | 11,029 | 1,108,903 |
| 7-or-more-person household Map | 14 | 9,142 | 898,211 |
Loading...