


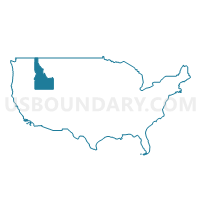
Idaho
About
Outline

Summary
| Unique Area Identifier | 201768 |
| Name | Idaho |
| Area (square miles) | 83,568.94 |
| Land Area (square miles) | 82,643.11 |
| Water Area (square miles) | 925.83 |
| % of Land Area | 98.89 |
| % of Water Area | 1.11 |
| Latitude of the Internal Point | 44.30209480 |
| Longtitude of the Internal Point | -114.59562540 |
| Total Population | 1,567,582 |
| Total Housing Units | 667,796 |
| Total Households | 579,408 |
| Median Age | 34.6 |
Maps
Graphs
Select a template below for downloading or customizing gragh for Idaho


Neighbors
Neighoring State and Equivalent (by Name) Neighboring State and Equivalent on the Map
County in Idaho (by Name) Neighboring County on the Map
- Ada County, ID
- Adams County, ID
- Bannock County, ID
- Bear Lake County, ID
- Benewah County, ID
- Bingham County, ID
- Blaine County, ID
- Boise County, ID
- Bonner County, ID
- Bonneville County, ID
- Boundary County, ID
- Butte County, ID
- Camas County, ID
- Canyon County, ID
- Caribou County, ID
- Cassia County, ID
- Clark County, ID
- Clearwater County, ID
- Custer County, ID
- Elmore County, ID
- Franklin County, ID
- Fremont County, ID
- Gem County, ID
- Gooding County, ID
- Idaho County, ID
- Jefferson County, ID
- Jerome County, ID
- Kootenai County, ID
- Latah County, ID
- Lemhi County, ID
- Lewis County, ID
- Lincoln County, ID
- Madison County, ID
- Minidoka County, ID
- Nez Perce County, ID
- Oneida County, ID
- Owyhee County, ID
- Payette County, ID
- Power County, ID
- Shoshone County, ID
- Teton County, ID
- Twin Falls County, ID
- Valley County, ID
- Washington County, ID
Top 10 County Subdivision in Idaho (by Population) Neighboring County Subdivision on the Map
- Boise City CCD, Ada County, ID (314,155)
- Nampa CCD, Canyon County, ID (119,851)
- Idaho Falls CCD, Bonneville County, ID (95,095)
- Coeur d'Alene CCD, Kootenai County, ID (72,052)
- Pocatello CCD, Bannock County, ID (71,772)
- Twin Falls CCD, Twin Falls County, ID (50,967)
- Post Falls-Rathdrum CCD, Kootenai County, ID (46,624)
- Caldwell CCD, Canyon County, ID (35,456)
- Lewiston CCD, Nez Perce County, ID (34,319)
- Eagle CCD, Ada County, ID (34,313)
Top 10 Place in Idaho (by Population) Neighboring Place on the Map
- Boise City city, ID (205,671)
- Nampa city, ID (81,557)
- Meridian city, ID (75,092)
- Idaho Falls city, ID (56,813)
- Pocatello city, ID (54,255)
- Caldwell city, ID (46,237)
- Coeur d'Alene city, ID (44,137)
- Twin Falls city, ID (44,125)
- Lewiston city, ID (31,894)
- Post Falls city, ID (27,574)
Top 10 Unified School District in Idaho (by Population) Neighboring Unified School District on the Map
- Boise City Independent School District 1, ID (184,995)
- Meridian Joint School District 2, ID (184,676)
- Nampa School District 131, ID (83,622)
- Pocatello School District 25, ID (76,013)
- Coeur d'Alene School District 271, ID (71,692)
- Idaho Falls School District 91, ID (56,313)
- Twin Falls School District 411, ID (51,059)
- Bonneville Joint School District 93, ID (45,322)
- Vallivue School District 139, ID (38,269)
- Post Falls School District 273, ID (36,257)
Top 10 State Legislative District Lower Chamber in Idaho (by Population) Neighboring State Legislative District Lower Chamber on the Map
- State House District 14, ID (76,940)
- State House District 21, ID (71,377)
- State House District 13, ID (58,725)
- State House District 32, ID (56,073)
- State House District 11, ID (51,062)
- State House District 20, ID (50,201)
- State House District 34, ID (49,686)
- State House District 10, ID (48,958)
- State House District 5, ID (46,466)
- State House District 23, ID (45,710)
Top 10 State Legislative District Upper Chamber in Idaho (by Population) Neighboring State Legislative District Upper Chamber on the Map
- State Senate District 14, ID (76,940)
- State Senate District 21, ID (71,377)
- State Senate District 13, ID (58,725)
- State Senate District 32, ID (56,073)
- State Senate District 11, ID (51,062)
- State Senate District 20, ID (50,201)
- State Senate District 34, ID (49,686)
- State Senate District 10, ID (48,958)
- State Senate District 5, ID (46,466)
- State Senate District 23, ID (45,710)
Top 10 111th Congressional District in Idaho (by Population) Neighboring 111th Congressional District on the Map
Top 10 Census Tract in Idaho (by Population) Neighboring Census Tract on the Map
- Census Tract 103.35, Ada County, ID (20,107)
- Census Tract 103.31, Ada County, ID (19,450)
- Census Tract 103.13, Ada County, ID (19,204)
- Census Tract 104.01, Ada County, ID (18,941)
- Census Tract 7, Kootenai County, ID (16,345)
- Census Tract 211, Canyon County, ID (15,829)
- Census Tract 209.02, Canyon County, ID (14,190)
- Census Tract 209.01, Canyon County, ID (12,861)
- Census Tract 210.01, Canyon County, ID (12,097)
- Census Tract 5, Kootenai County, ID (11,586)
Top 10 5-Digit ZIP Code Tabulation Area in Idaho (by Population) Neighboring 5-Digit ZIP Code Tabulation Area on the Map
- 83301, ID (52,010)
- 83709, ID (50,034)
- 83646, ID (47,098)
- 83686, ID (46,224)
- 83605, ID (39,649)
- 83704, ID (39,628)
- 83401, ID (37,966)
- 83854, ID (37,245)
- 83201, ID (37,199)
- 83642, ID (37,008)
Data
Demographic, Population, Households, and Housing Units
** Data sources from census 2010 **
Show Data on Map
Download Full List as CSV
Download Quick Sheet as CSV
| Subject | This Area | National |
|---|---|---|
| POPULATION | ||
| Total Population Map | 1,567,582 | 308,745,538 |
| POPULATION, HISPANIC OR LATINO ORIGIN | ||
| Not Hispanic or Latino Map | 1,391,681 | 258,267,944 |
| Hispanic or Latino Map | 175,901 | 50,477,594 |
| POPULATION, RACE | ||
| White alone Map | 1,396,487 | 223,553,265 |
| Black or African American alone Map | 9,810 | 38,929,319 |
| American Indian and Alaska Native alone Map | 21,441 | 2,932,248 |
| Asian alone Map | 19,069 | 14,674,252 |
| Native Hawaiian and Other Pacific Islander alone Map | 2,317 | 540,013 |
| Some Other Race alone Map | 79,523 | 19,107,368 |
| Two or More Races Map | 38,935 | 9,009,073 |
| POPULATION, SEX | ||
| Male Map | 785,324 | 151,781,326 |
| Female Map | 782,258 | 156,964,212 |
| POPULATION, AGE (18 YEARS) | ||
| 18 years and over Map | 1,138,510 | 234,564,071 |
| Under 18 years | 429,072 | 74,181,467 |
| POPULATION, AGE | ||
| Under 5 years | 121,772 | 20,201,362 |
| 5 to 9 years | 121,195 | 20,348,657 |
| 10 to 14 years | 116,955 | 20,677,194 |
| 15 to 17 years | 69,150 | 12,954,254 |
| 18 and 19 years | 46,209 | 9,086,089 |
| 20 years | 22,204 | 4,519,129 |
| 21 years | 21,776 | 4,354,294 |
| 22 to 24 years | 64,229 | 12,712,576 |
| 25 to 29 years | 106,734 | 21,101,849 |
| 30 to 34 years | 102,231 | 19,962,099 |
| 35 to 39 years | 96,845 | 20,179,642 |
| 40 to 44 years | 94,764 | 20,890,964 |
| 45 to 49 years | 103,560 | 22,708,591 |
| 50 to 54 years | 104,977 | 22,298,125 |
| 55 to 59 years | 96,997 | 19,664,805 |
| 60 and 61 years | 35,125 | 7,113,727 |
| 62 to 64 years | 48,191 | 9,704,197 |
| 65 and 66 years | 27,113 | 5,319,902 |
| 67 to 69 years | 36,315 | 7,115,361 |
| 70 to 74 years | 46,106 | 9,278,166 |
| 75 to 79 years | 34,278 | 7,317,795 |
| 80 to 84 years | 25,614 | 5,743,327 |
| 85 years and over | 25,242 | 5,493,433 |
| MEDIAN AGE BY SEX | ||
| Both sexes Map | 34.60 | 37.20 |
| Male Map | 33.70 | 35.80 |
| Female Map | 35.40 | 38.50 |
| HOUSEHOLDS | ||
| Total Households Map | 579,408 | 116,716,292 |
| HOUSEHOLDS, HOUSEHOLD TYPE | ||
| Family households: Map | 403,144 | 77,538,296 |
| Husband-wife family Map | 320,390 | 56,510,377 |
| Other family: Map | 82,754 | 21,027,919 |
| Male householder, no wife present Map | 27,085 | 5,777,570 |
| Female householder, no husband present Map | 55,669 | 15,250,349 |
| Nonfamily households: Map | 176,264 | 39,177,996 |
| Householder living alone Map | 137,785 | 31,204,909 |
| Householder not living alone Map | 38,479 | 7,973,087 |
| HOUSEHOLDS, HISPANIC OR LATINO ORIGIN OF HOUSEHOLDER | ||
| Not Hispanic or Latino householder: Map | 535,994 | 103,254,926 |
| Hispanic or Latino householder: Map | 43,414 | 13,461,366 |
| HOUSEHOLDS, RACE OF HOUSEHOLDER | ||
| Householder who is White alone | 533,392 | 89,754,352 |
| Householder who is Black or African American alone | 2,797 | 14,129,983 |
| Householder who is American Indian and Alaska Native alone | 6,918 | 939,707 |
| Householder who is Asian alone | 5,989 | 4,632,164 |
| Householder who is Native Hawaiian and Other Pacific Islander alone | 667 | 143,932 |
| Householder who is Some Other Race alone | 20,422 | 4,916,427 |
| Householder who is Two or More Races | 9,223 | 2,199,727 |
| HOUSEHOLDS, HOUSEHOLD TYPE BY HOUSEHOLD SIZE | ||
| Family households: Map | 403,144 | 77,538,296 |
| 2-person household Map | 174,880 | 31,882,616 |
| 3-person household Map | 82,320 | 17,765,829 |
| 4-person household Map | 73,241 | 15,214,075 |
| 5-person household Map | 40,522 | 7,411,997 |
| 6-person household Map | 19,662 | 3,026,278 |
| 7-or-more-person household Map | 12,519 | 2,237,501 |
| Nonfamily households: Map | 176,264 | 39,177,996 |
| 1-person household Map | 137,785 | 31,204,909 |
| 2-person household Map | 29,251 | 6,360,012 |
| 3-person household Map | 5,222 | 992,156 |
| 4-person household Map | 2,086 | 411,171 |
| 5-person household Map | 801 | 126,634 |
| 6-person household Map | 960 | 48,421 |
| 7-or-more-person household Map | 159 | 34,693 |
| HOUSING UNITS | ||
| Total Housing Units Map | 667,796 | 131,704,730 |
| HOUSING UNITS, OCCUPANCY STATUS | ||
| Occupied Map | 579,408 | 116,716,292 |
| Vacant Map | 88,388 | 14,988,438 |
| HOUSING UNITS, OCCUPIED, TENURE | ||
| Owned with a mortgage or a loan Map | 286,971 | 52,979,430 |
| Owned free and clear Map | 117,932 | 23,006,644 |
| Renter occupied Map | 174,505 | 40,730,218 |
| HOUSING UNITS, VACANT, VACANCY STATUS | ||
| For rent Map | 16,360 | 4,137,567 |
| Rented, not occupied Map | 997 | 206,825 |
| For sale only Map | 12,814 | 1,896,796 |
| Sold, not occupied Map | 2,177 | 421,032 |
| For seasonal, recreational, or occasional use Map | 41,660 | 4,649,298 |
| For migrant workers Map | 632 | 24,161 |
| Other vacant Map | 13,748 | 3,652,759 |
| HOUSING UNITS, OCCUPIED, AVERAGE HOUSEHOLD SIZE BY TENURE | ||
| Total: Map | 2.66 | 2.58 |
| Owner occupied Map | 2.70 | 2.65 |
| Renter occupied Map | 2.56 | 2.44 |
| HOUSING UNITS, OCCUPIED, TENURE BY RACE OF HOUSEHOLDER | ||
| Owner occupied: Map | 404,903 | 75,986,074 |
| Householder who is White alone Map | 380,646 | 63,446,275 |
| Householder who is Black or African American alone Map | 1,027 | 6,261,464 |
| Householder who is American Indian and Alaska Native alone Map | 3,961 | 509,588 |
| Householder who is Asian alone Map | 3,586 | 2,688,861 |
| Householder who is Native Hawaiian and Other Pacific Islander alone Map | 316 | 61,911 |
| Householder who is Some Other Race alone Map | 10,510 | 1,975,817 |
| Householder who is Two or More Races Map | 4,857 | 1,042,158 |
| Renter occupied: Map | 174,505 | 40,730,218 |
| Householder who is White alone Map | 152,746 | 26,308,077 |
| Householder who is Black or African American alone Map | 1,770 | 7,868,519 |
| Householder who is American Indian and Alaska Native alone Map | 2,957 | 430,119 |
| Householder who is Asian alone Map | 2,403 | 1,943,303 |
| Householder who is Native Hawaiian and Other Pacific Islander alone Map | 351 | 82,021 |
| Householder who is Some Other Race alone Map | 9,912 | 2,940,610 |
| Householder who is Two or More Races Map | 4,366 | 1,157,569 |
| HOUSING UNITS, OCCUPIED, TENURE BY HISPANIC OR LATINO ORIGIN OF HOUSEHOLDER | ||
| Owner occupied: Map | 404,903 | 75,986,074 |
| Not Hispanic or Latino householder Map | 381,867 | 69,617,625 |
| Hispanic or Latino householder Map | 23,036 | 6,368,449 |
| Renter occupied: Map | 174,505 | 40,730,218 |
| Not Hispanic or Latino householder Map | 154,127 | 33,637,301 |
| Hispanic or Latino householder Map | 20,378 | 7,092,917 |
| HOUSING UNITS, OCCUPIED, TENURE BY HOUSEHOLD SIZE | ||
| Owner occupied: Map | 404,903 | 75,986,074 |
| 1-person household Map | 81,134 | 16,453,569 |
| 2-person household Map | 157,743 | 27,618,605 |
| 3-person household Map | 59,602 | 12,517,563 |
| 4-person household Map | 54,046 | 10,998,793 |
| 5-person household Map | 29,170 | 5,057,765 |
| 6-person household Map | 14,207 | 1,965,796 |
| 7-or-more-person household Map | 9,001 | 1,373,983 |
| Renter occupied: Map | 174,505 | 40,730,218 |
| 1-person household Map | 56,651 | 14,751,340 |
| 2-person household Map | 46,388 | 10,624,023 |
| 3-person household Map | 27,940 | 6,240,422 |
| 4-person household Map | 21,281 | 4,626,453 |
| 5-person household Map | 12,153 | 2,480,866 |
| 6-person household Map | 6,415 | 1,108,903 |
| 7-or-more-person household Map | 3,677 | 898,211 |
Loading...