


Covington Independent School District, Kentucky
About
Outline

Summary
| Unique Area Identifier | 513222 |
| Name | Covington Independent School District |
| State | Kentucky |
| Area (square miles) | 6.91 |
| Land Area (square miles) | 6.42 |
| Water Area (square miles) | 0.49 |
| % of Land Area | 92.91 |
| % of Water Area | 7.09 |
| Latitude of the Internal Point | 39.06887220 |
| Longtitude of the Internal Point | -84.51511630 |
| Total Population | 33,049 |
| Total Housing Units | 17,195 |
| Total Households | 14,319 |
| Median Age | 35.2 |
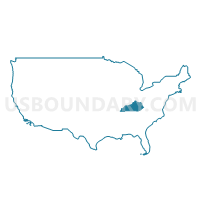
Maps

Graphs
Select a template below for downloading or customizing gragh for Covington Independent School District, Kentucky


Neighbors
Neighoring Unified School District (by Name) Neighboring Unified School District on the Map
- Campbell County School District, KY
- Cincinnati City School District, OH
- Kenton County School District, KY
- Ludlow Independent School District, KY
- Newport Independent School District, KY
Top 10 Neighboring County (by Population) Neighboring County on the Map
Top 10 Neighboring County Subdivision (by Population) Neighboring County Subdivision on the Map
- Cincinnati city, Hamilton County, OH (296,943)
- Covington CCD, Kenton County, KY (111,047)
- Newport-Fort Thomas CCD, Campbell County, KY (68,138)
Top 10 Neighboring Place (by Population) Neighboring Place on the Map
- Cincinnati city, OH (296,943)
- Covington city, KY (40,640)
- Newport city, KY (15,273)
- Taylor Mill city, KY (6,604)
- Fort Wright city, KY (5,723)
- Ludlow city, KY (4,407)
- Wilder city, KY (3,035)
- Park Hills city, KY (2,970)
- Kenton Vale city, KY (110)
Top 10 Neighboring State Legislative District Lower Chamber (by Population) Neighboring State Legislative District Lower Chamber on the Map
- State House District 32, OH (103,395)
- State House District 64, KY (49,008)
- State House District 63, KY (40,380)
- State House District 67, KY (37,613)
- State House District 65, KY (35,617)
Top 10 Neighboring State Legislative District Upper Chamber (by Population) Neighboring State Legislative District Upper Chamber on the Map
- State Senate District 9, OH (298,658)
- State Senate District 24, KY (105,213)
- State Senate District 23, KY (98,810)
Top 10 Neighboring 111th Congressional District (by Population) Neighboring 111th Congressional District on the Map
- Congressional District 4, KY (741,464)
- Congressional District 2, OH (673,873)
- Congressional District 1, OH (598,699)
Top 10 Neighboring Census Tract (by Population) Neighboring Census Tract on the Map
- Census Tract 653, Kenton County, KY (9,730)
- Census Tract 533.02, Campbell County, KY (4,973)
- Census Tract 669, Kenton County, KY (4,304)
- Census Tract 652, Kenton County, KY (3,928)
- Census Tract 650, Kenton County, KY (3,669)
- Census Tract 614, Kenton County, KY (3,626)
- Census Tract 651, Kenton County, KY (3,498)
- Census Tract 670, Kenton County, KY (3,464)
- Census Tract 648, Kenton County, KY (3,401)
- Census Tract 649, Kenton County, KY (3,009)
Top 10 Neighboring 5-Digit ZIP Code Tabulation Area (by Population) Neighboring 5-Digit ZIP Code Tabulation Area on the Map
- 41011, KY (25,872)
- 41071, KY (20,869)
- 41015, KY (20,864)
- 41076, KY (16,468)
- 45202, OH (15,483)
- 41014, KY (6,942)
- 41016, KY (6,075)
- 45203, OH (2,236)
Data
Demographic, Population, Households, and Housing Units
** Data sources from census 2010 **
Show Data on Map
Download Full List as CSV
Download Quick Sheet as CSV
| Subject | This Area | Kentucky | National |
|---|---|---|---|
| POPULATION | |||
| Total Population Map | 33,049 | 4,339,367 | 308,745,538 |
| POPULATION, HISPANIC OR LATINO ORIGIN | |||
| Not Hispanic or Latino Map | 31,734 | 4,206,531 | 258,267,944 |
| Hispanic or Latino Map | 1,315 | 132,836 | 50,477,594 |
| POPULATION, RACE | |||
| White alone Map | 26,136 | 3,809,537 | 223,553,265 |
| Black or African American alone Map | 4,718 | 337,520 | 38,929,319 |
| American Indian and Alaska Native alone Map | 86 | 10,120 | 2,932,248 |
| Asian alone Map | 157 | 48,930 | 14,674,252 |
| Native Hawaiian and Other Pacific Islander alone Map | 53 | 2,501 | 540,013 |
| Some Other Race alone Map | 735 | 55,551 | 19,107,368 |
| Two or More Races Map | 1,164 | 75,208 | 9,009,073 |
| POPULATION, SEX | |||
| Male Map | 16,697 | 2,134,952 | 151,781,326 |
| Female Map | 16,352 | 2,204,415 | 156,964,212 |
| POPULATION, AGE (18 YEARS) | |||
| 18 years and over Map | 25,841 | 3,315,996 | 234,564,071 |
| Under 18 years | 7,208 | 1,023,371 | 74,181,467 |
| POPULATION, AGE | |||
| Under 5 years | 2,494 | 282,367 | 20,201,362 |
| 5 to 9 years | 2,034 | 282,888 | 20,348,657 |
| 10 to 14 years | 1,667 | 284,154 | 20,677,194 |
| 15 to 17 years | 1,013 | 173,962 | 12,954,254 |
| 18 and 19 years | 738 | 122,833 | 9,086,089 |
| 20 years | 464 | 61,268 | 4,519,129 |
| 21 years | 447 | 58,657 | 4,354,294 |
| 22 to 24 years | 1,692 | 170,043 | 12,712,576 |
| 25 to 29 years | 3,213 | 285,296 | 21,101,849 |
| 30 to 34 years | 2,683 | 280,920 | 19,962,099 |
| 35 to 39 years | 2,128 | 285,411 | 20,179,642 |
| 40 to 44 years | 2,233 | 291,251 | 20,890,964 |
| 45 to 49 years | 2,448 | 323,642 | 22,708,591 |
| 50 to 54 years | 2,513 | 319,455 | 22,298,125 |
| 55 to 59 years | 2,043 | 288,027 | 19,664,805 |
| 60 and 61 years | 742 | 106,469 | 7,113,727 |
| 62 to 64 years | 932 | 144,497 | 9,704,197 |
| 65 and 66 years | 430 | 78,497 | 5,319,902 |
| 67 to 69 years | 597 | 107,167 | 7,115,361 |
| 70 to 74 years | 862 | 139,650 | 9,278,166 |
| 75 to 79 years | 616 | 105,392 | 7,317,795 |
| 80 to 84 years | 533 | 78,313 | 5,743,327 |
| 85 years and over | 527 | 69,208 | 5,493,433 |
| MEDIAN AGE BY SEX | |||
| Both sexes Map | 35.20 | 38.10 | 37.20 |
| Male Map | 34.60 | 36.70 | 35.80 |
| Female Map | 35.90 | 39.30 | 38.50 |
| HOUSEHOLDS | |||
| Total Households Map | 14,319 | 1,719,965 | 116,716,292 |
| HOUSEHOLDS, HOUSEHOLD TYPE | |||
| Family households: Map | 7,027 | 1,149,905 | 77,538,296 |
| Husband-wife family Map | 3,611 | 848,324 | 56,510,377 |
| Other family: Map | 3,416 | 301,581 | 21,027,919 |
| Male householder, no wife present Map | 838 | 82,545 | 5,777,570 |
| Female householder, no husband present Map | 2,578 | 219,036 | 15,250,349 |
| Nonfamily households: Map | 7,292 | 570,060 | 39,177,996 |
| Householder living alone Map | 5,764 | 473,447 | 31,204,909 |
| Householder not living alone Map | 1,528 | 96,613 | 7,973,087 |
| HOUSEHOLDS, HISPANIC OR LATINO ORIGIN OF HOUSEHOLDER | |||
| Not Hispanic or Latino householder: Map | 13,986 | 1,685,985 | 103,254,926 |
| Hispanic or Latino householder: Map | 333 | 33,980 | 13,461,366 |
| HOUSEHOLDS, RACE OF HOUSEHOLDER | |||
| Householder who is White alone | 11,976 | 1,540,334 | 89,754,352 |
| Householder who is Black or African American alone | 1,800 | 128,856 | 14,129,983 |
| Householder who is American Indian and Alaska Native alone | 45 | 4,014 | 939,707 |
| Householder who is Asian alone | 72 | 15,476 | 4,632,164 |
| Householder who is Native Hawaiian and Other Pacific Islander alone | 12 | 667 | 143,932 |
| Householder who is Some Other Race alone | 169 | 13,756 | 4,916,427 |
| Householder who is Two or More Races | 245 | 16,862 | 2,199,727 |
| HOUSEHOLDS, HOUSEHOLD TYPE BY HOUSEHOLD SIZE | |||
| Family households: Map | 7,027 | 1,149,905 | 77,538,296 |
| 2-person household Map | 2,961 | 512,506 | 31,882,616 |
| 3-person household Map | 1,715 | 279,227 | 17,765,829 |
| 4-person household Map | 1,224 | 215,271 | 15,214,075 |
| 5-person household Map | 633 | 92,558 | 7,411,997 |
| 6-person household Map | 266 | 32,372 | 3,026,278 |
| 7-or-more-person household Map | 228 | 17,971 | 2,237,501 |
| Nonfamily households: Map | 7,292 | 570,060 | 39,177,996 |
| 1-person household Map | 5,764 | 473,447 | 31,204,909 |
| 2-person household Map | 1,303 | 79,041 | 6,360,012 |
| 3-person household Map | 153 | 11,214 | 992,156 |
| 4-person household Map | 40 | 4,493 | 411,171 |
| 5-person household Map | 17 | 1,290 | 126,634 |
| 6-person household Map | 6 | 354 | 48,421 |
| 7-or-more-person household Map | 9 | 221 | 34,693 |
| HOUSING UNITS | |||
| Total Housing Units Map | 17,195 | 1,927,164 | 131,704,730 |
| HOUSING UNITS, OCCUPANCY STATUS | |||
| Occupied Map | 14,319 | 1,719,965 | 116,716,292 |
| Vacant Map | 2,876 | 207,199 | 14,988,438 |
| HOUSING UNITS, OCCUPIED, TENURE | |||
| Owned with a mortgage or a loan Map | 4,816 | 757,084 | 52,979,430 |
| Owned free and clear Map | 1,500 | 424,187 | 23,006,644 |
| Renter occupied Map | 8,003 | 538,694 | 40,730,218 |
| HOUSING UNITS, VACANT, VACANCY STATUS | |||
| For rent Map | 1,107 | 56,960 | 4,137,567 |
| Rented, not occupied Map | 29 | 3,059 | 206,825 |
| For sale only Map | 436 | 27,286 | 1,896,796 |
| Sold, not occupied Map | 92 | 8,687 | 421,032 |
| For seasonal, recreational, or occasional use Map | 99 | 38,616 | 4,649,298 |
| For migrant workers Map | 1 | 627 | 24,161 |
| Other vacant Map | 1,112 | 71,964 | 3,652,759 |
| HOUSING UNITS, OCCUPIED, AVERAGE HOUSEHOLD SIZE BY TENURE | |||
| Total: Map | 2.21 | 2.45 | 2.58 |
| Owner occupied Map | 2.28 | 2.51 | 2.65 |
| Renter occupied Map | 2.17 | 2.31 | 2.44 |
| HOUSING UNITS, OCCUPIED, TENURE BY RACE OF HOUSEHOLDER | |||
| Owner occupied: Map | 6,316 | 1,181,271 | 75,986,074 |
| Householder who is White alone Map | 5,762 | 1,108,967 | 63,446,275 |
| Householder who is Black or African American alone Map | 417 | 50,706 | 6,261,464 |
| Householder who is American Indian and Alaska Native alone Map | 12 | 2,063 | 509,588 |
| Householder who is Asian alone Map | 25 | 7,662 | 2,688,861 |
| Householder who is Native Hawaiian and Other Pacific Islander alone Map | 1 | 254 | 61,911 |
| Householder who is Some Other Race alone Map | 29 | 3,682 | 1,975,817 |
| Householder who is Two or More Races Map | 70 | 7,937 | 1,042,158 |
| Renter occupied: Map | 8,003 | 538,694 | 40,730,218 |
| Householder who is White alone Map | 6,214 | 431,367 | 26,308,077 |
| Householder who is Black or African American alone Map | 1,383 | 78,150 | 7,868,519 |
| Householder who is American Indian and Alaska Native alone Map | 33 | 1,951 | 430,119 |
| Householder who is Asian alone Map | 47 | 7,814 | 1,943,303 |
| Householder who is Native Hawaiian and Other Pacific Islander alone Map | 11 | 413 | 82,021 |
| Householder who is Some Other Race alone Map | 140 | 10,074 | 2,940,610 |
| Householder who is Two or More Races Map | 175 | 8,925 | 1,157,569 |
| HOUSING UNITS, OCCUPIED, TENURE BY HISPANIC OR LATINO ORIGIN OF HOUSEHOLDER | |||
| Owner occupied: Map | 6,316 | 1,181,271 | 75,986,074 |
| Not Hispanic or Latino householder Map | 6,255 | 1,169,209 | 69,617,625 |
| Hispanic or Latino householder Map | 61 | 12,062 | 6,368,449 |
| Renter occupied: Map | 8,003 | 538,694 | 40,730,218 |
| Not Hispanic or Latino householder Map | 7,731 | 516,776 | 33,637,301 |
| Hispanic or Latino householder Map | 272 | 21,918 | 7,092,917 |
| HOUSING UNITS, OCCUPIED, TENURE BY HOUSEHOLD SIZE | |||
| Owner occupied: Map | 6,316 | 1,181,271 | 75,986,074 |
| 1-person household Map | 2,067 | 269,220 | 16,453,569 |
| 2-person household Map | 2,283 | 449,271 | 27,618,605 |
| 3-person household Map | 908 | 204,423 | 12,517,563 |
| 4-person household Map | 606 | 159,701 | 10,998,793 |
| 5-person household Map | 271 | 65,252 | 5,057,765 |
| 6-person household Map | 98 | 21,816 | 1,965,796 |
| 7-or-more-person household Map | 83 | 11,588 | 1,373,983 |
| Renter occupied: Map | 8,003 | 538,694 | 40,730,218 |
| 1-person household Map | 3,697 | 204,227 | 14,751,340 |
| 2-person household Map | 1,981 | 142,276 | 10,624,023 |
| 3-person household Map | 960 | 86,018 | 6,240,422 |
| 4-person household Map | 658 | 60,063 | 4,626,453 |
| 5-person household Map | 379 | 28,596 | 2,480,866 |
| 6-person household Map | 174 | 10,910 | 1,108,903 |
| 7-or-more-person household Map | 154 | 6,604 | 898,211 |
Loading...