


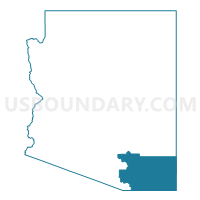
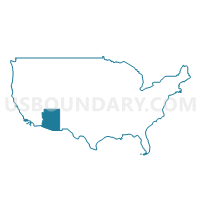
Congressional District 8, Arizona
About
Outline

Summary
| Unique Area Identifier | 119041 |
| Name | Congressional District 8 |
| State | Arizona |
| Area (square miles) | 9,057.17 |
| Land Area (square miles) | 9,002.56 |
| Water Area (square miles) | 54.61 |
| % of Land Area | 99.40 |
| % of Water Area | 0.60 |
| Latitude of the Internal Point | 31.91415260 |
| Longtitude of the Internal Point | -110.06361080 |
| Total Population | 754,300 |
| Total Housing Units | 360,017 |
| Total Households | 316,239 |
| Median Age | 42.1 |
Maps
Graphs
Select a template below for downloading or customizing gragh for Congressional District 8, Arizona


Neighbors
Neighoring 111th Congressional District (by Name) Neighboring 111th Congressional District on the Map
Top 10 Neighboring County (by Population) Neighboring County on the Map
- Pima County, AZ (980,263)
- Pinal County, AZ (375,770)
- Cochise County, AZ (131,346)
- Santa Cruz County, AZ (47,420)
- Graham County, AZ (37,220)
- Greenlee County, AZ (8,437)
- Hidalgo County, NM (4,894)
Top 10 Neighboring County Subdivision (by Population) Neighboring County Subdivision on the Map
- Tucson CCD, Pima County, AZ (853,603)
- Arivaca CCD, Pima County, AZ (81,534)
- Sierra Vista CCD, Cochise County, AZ (51,125)
- Nogales CCD, Santa Cruz County, AZ (44,207)
- Florence CCD, Pinal County, AZ (34,685)
- Marana CCD, Pima County, AZ (34,429)
- Eloy CCD, Pinal County, AZ (32,559)
- Bisbee CCD, Cochise County, AZ (29,838)
- Safford CCD, Graham County, AZ (24,993)
- San Manuel CCD, Pinal County, AZ (20,418)
Top 10 Neighboring Place (by Population) Neighboring Place on the Map
- Tucson city, AZ (520,116)
- Casas Adobes CDP, AZ (66,795)
- Catalina Foothills CDP, AZ (50,796)
- Sierra Vista city, AZ (43,888)
- Oro Valley town, AZ (41,011)
- Marana town, AZ (34,961)
- Sahuarita town, AZ (25,259)
- Green Valley CDP, AZ (21,391)
- Rio Rico CDP, AZ (18,962)
- Douglas city, AZ (17,378)
Top 10 Neighboring Elementary School District (by Population) Neighboring Elementary School District on the Map
- Continental Elementary District, AZ (26,016)
- Oracle Elementary District, AZ (13,622)
- Palominas Elementary District, AZ (10,521)
- Altar Valley Elementary District, AZ (7,275)
- Red Rock Elementary District, AZ (3,364)
- Solomon Elementary District, AZ (2,883)
- Pearce Elementary District, AZ (2,069)
- Sonoita Elementary District, AZ (1,849)
- Santa Cruz Elementary District, AZ (1,753)
- Patagonia Elementary District, AZ (1,533)
Top 10 Neighboring Secondary School District (by Population) Neighboring Secondary School District on the Map
- Santa Cruz Valley Union High School District, AZ (18,271)
- Valley Union High School District, AZ (3,894)
- Patagonia Union High School District, AZ (3,382)
Top 10 Neighboring Unified School District (by Population) Neighboring Unified School District on the Map
- Tucson Unified District, AZ (472,675)
- Amphitheater Unified District, AZ (136,207)
- Sunnyside Unified District, AZ (87,770)
- Marana Unified District, AZ (86,614)
- School District Not Defined, AZ (69,809)
- Vail Unified District, AZ (52,532)
- Sierra Vista Unified District, AZ (48,962)
- Catalina Foothills Unified District, AZ (31,188)
- Flowing Wells Unified District, AZ (30,010)
- Sahuarita Unified District, AZ (27,042)
Top 10 Neighboring State Legislative District Lower Chamber (by Population) Neighboring State Legislative District Lower Chamber on the Map
- State House District 23, AZ (370,479)
- State House District 30, AZ (231,236)
- State House District 25, AZ (208,220)
- State House District 27, AZ (199,340)
- State House District 26, AZ (195,881)
- State House District 5, AZ (192,258)
- State House District 29, AZ (184,459)
- State House District 28, AZ (170,527)
- State House District 39, NM (22,945)
Top 10 Neighboring State Legislative District Upper Chamber (by Population) Neighboring State Legislative District Upper Chamber on the Map
- State Senate District 23, AZ (370,479)
- State Senate District 30, AZ (231,236)
- State Senate District 25, AZ (208,220)
- State Senate District 27, AZ (199,340)
- State Senate District 26, AZ (195,881)
- State Senate District 5, AZ (192,258)
- State Senate District 29, AZ (184,459)
- State Senate District 28, AZ (170,527)
- State Senate District 35, NM (39,691)
Top 10 Neighboring Census Tract (by Population) Neighboring Census Tract on the Map
- Census Tract 9661.04, Santa Cruz County, AZ (9,945)
- Census Tract 43.29, Pima County, AZ (9,743)
- Census Tract 18, Cochise County, AZ (9,219)
- Census Tract 41.07, Pima County, AZ (8,521)
- Census Tract 44.27, Pima County, AZ (8,138)
- Census Tract 35.01, Pima County, AZ (8,085)
- Census Tract 40.64, Pima County, AZ (7,696)
- Census Tract 46.38, Pima County, AZ (7,416)
- Census Tract 44.29, Pima County, AZ (7,398)
- Census Tract 40.11, Pima County, AZ (7,393)
Top 10 Neighboring 5-Digit ZIP Code Tabulation Area (by Population) Neighboring 5-Digit ZIP Code Tabulation Area on the Map
- 85705, AZ (57,521)
- 85706, AZ (55,209)
- 85710, AZ (54,439)
- 85713, AZ (50,151)
- 85719, AZ (43,989)
- 85746, AZ (43,057)
- 85711, AZ (41,251)
- 85730, AZ (38,323)
- 85745, AZ (37,006)
- 85756, AZ (35,703)
Data
Demographic, Population, Households, and Housing Units
** Data sources from census 2010 **
Show Data on Map
Download Full List as CSV
Download Quick Sheet as CSV
| Subject | This Area | Arizona | National |
|---|---|---|---|
| POPULATION | |||
| Total Population Map | 754,300 | 6,392,017 | 308,745,538 |
| POPULATION, HISPANIC OR LATINO ORIGIN | |||
| Not Hispanic or Latino Map | 583,176 | 4,496,868 | 258,267,944 |
| Hispanic or Latino Map | 171,124 | 1,895,149 | 50,477,594 |
| POPULATION, RACE | |||
| White alone Map | 617,305 | 4,667,121 | 223,553,265 |
| Black or African American alone Map | 27,128 | 259,008 | 38,929,319 |
| American Indian and Alaska Native alone Map | 8,970 | 296,529 | 2,932,248 |
| Asian alone Map | 20,903 | 176,695 | 14,674,252 |
| Native Hawaiian and Other Pacific Islander alone Map | 1,558 | 12,648 | 540,013 |
| Some Other Race alone Map | 51,216 | 761,716 | 19,107,368 |
| Two or More Races Map | 27,220 | 218,300 | 9,009,073 |
| POPULATION, SEX | |||
| Male Map | 371,129 | 3,175,823 | 151,781,326 |
| Female Map | 383,171 | 3,216,194 | 156,964,212 |
| POPULATION, AGE (18 YEARS) | |||
| 18 years and over Map | 596,269 | 4,763,003 | 234,564,071 |
| Under 18 years | 158,031 | 1,629,014 | 74,181,467 |
| POPULATION, AGE | |||
| Under 5 years | 42,981 | 455,715 | 20,201,362 |
| 5 to 9 years | 42,887 | 453,680 | 20,348,657 |
| 10 to 14 years | 44,134 | 448,664 | 20,677,194 |
| 15 to 17 years | 28,029 | 270,955 | 12,954,254 |
| 18 and 19 years | 18,436 | 190,627 | 9,086,089 |
| 20 years | 9,678 | 93,756 | 4,519,129 |
| 21 years | 9,270 | 89,342 | 4,354,294 |
| 22 to 24 years | 27,995 | 259,486 | 12,712,576 |
| 25 to 29 years | 47,937 | 439,998 | 21,101,849 |
| 30 to 34 years | 43,643 | 416,695 | 19,962,099 |
| 35 to 39 years | 43,311 | 415,693 | 20,179,642 |
| 40 to 44 years | 43,559 | 406,801 | 20,890,964 |
| 45 to 49 years | 50,476 | 427,022 | 22,708,591 |
| 50 to 54 years | 54,611 | 415,524 | 22,298,125 |
| 55 to 59 years | 53,023 | 375,268 | 19,664,805 |
| 60 and 61 years | 20,805 | 144,092 | 7,113,727 |
| 62 to 64 years | 30,916 | 206,868 | 9,704,197 |
| 65 and 66 years | 18,171 | 119,102 | 5,319,902 |
| 67 to 69 years | 25,418 | 163,764 | 7,115,361 |
| 70 to 74 years | 33,877 | 215,026 | 9,278,166 |
| 75 to 79 years | 26,596 | 162,261 | 7,317,795 |
| 80 to 84 years | 20,107 | 118,278 | 5,743,327 |
| 85 years and over | 18,440 | 103,400 | 5,493,433 |
| MEDIAN AGE BY SEX | |||
| Both sexes Map | 42.10 | 35.90 | 37.20 |
| Male Map | 40.30 | 34.80 | 35.80 |
| Female Map | 44.10 | 37.20 | 38.50 |
| HOUSEHOLDS | |||
| Total Households Map | 316,239 | 2,380,990 | 116,716,292 |
| HOUSEHOLDS, HOUSEHOLD TYPE | |||
| Family households: Map | 199,354 | 1,576,520 | 77,538,296 |
| Husband-wife family Map | 153,181 | 1,146,036 | 56,510,377 |
| Other family: Map | 46,173 | 430,484 | 21,027,919 |
| Male householder, no wife present Map | 13,603 | 134,171 | 5,777,570 |
| Female householder, no husband present Map | 32,570 | 296,313 | 15,250,349 |
| Nonfamily households: Map | 116,885 | 804,470 | 39,177,996 |
| Householder living alone Map | 94,393 | 621,008 | 31,204,909 |
| Householder not living alone Map | 22,492 | 183,462 | 7,973,087 |
| HOUSEHOLDS, HISPANIC OR LATINO ORIGIN OF HOUSEHOLDER | |||
| Not Hispanic or Latino householder: Map | 265,065 | 1,880,167 | 103,254,926 |
| Hispanic or Latino householder: Map | 51,174 | 500,823 | 13,461,366 |
| HOUSEHOLDS, RACE OF HOUSEHOLDER | |||
| Householder who is White alone | 272,950 | 1,892,326 | 89,754,352 |
| Householder who is Black or African American alone | 10,217 | 92,994 | 14,129,983 |
| Householder who is American Indian and Alaska Native alone | 2,979 | 82,898 | 939,707 |
| Householder who is Asian alone | 7,226 | 57,594 | 4,632,164 |
| Householder who is Native Hawaiian and Other Pacific Islander alone | 517 | 3,443 | 143,932 |
| Householder who is Some Other Race alone | 15,461 | 200,098 | 4,916,427 |
| Householder who is Two or More Races | 6,889 | 51,637 | 2,199,727 |
| HOUSEHOLDS, HOUSEHOLD TYPE BY HOUSEHOLD SIZE | |||
| Family households: Map | 199,354 | 1,576,520 | 77,538,296 |
| 2-person household Map | 102,527 | 665,956 | 31,882,616 |
| 3-person household Map | 40,494 | 322,155 | 17,765,829 |
| 4-person household Map | 32,214 | 288,309 | 15,214,075 |
| 5-person household Map | 14,901 | 162,449 | 7,411,997 |
| 6-person household Map | 5,923 | 76,255 | 3,026,278 |
| 7-or-more-person household Map | 3,295 | 61,396 | 2,237,501 |
| Nonfamily households: Map | 116,885 | 804,470 | 39,177,996 |
| 1-person household Map | 94,393 | 621,008 | 31,204,909 |
| 2-person household Map | 19,006 | 148,999 | 6,360,012 |
| 3-person household Map | 2,333 | 22,171 | 992,156 |
| 4-person household Map | 784 | 8,346 | 411,171 |
| 5-person household Map | 206 | 2,495 | 126,634 |
| 6-person household Map | 75 | 840 | 48,421 |
| 7-or-more-person household Map | 88 | 611 | 34,693 |
| HOUSING UNITS | |||
| Total Housing Units Map | 360,017 | 2,844,526 | 131,704,730 |
| HOUSING UNITS, OCCUPANCY STATUS | |||
| Occupied Map | 316,239 | 2,380,990 | 116,716,292 |
| Vacant Map | 43,778 | 463,536 | 14,988,438 |
| HOUSING UNITS, OCCUPIED, TENURE | |||
| Owned with a mortgage or a loan Map | 147,992 | 1,132,662 | 52,979,430 |
| Owned free and clear Map | 66,249 | 439,025 | 23,006,644 |
| Renter occupied Map | 101,998 | 809,303 | 40,730,218 |
| HOUSING UNITS, VACANT, VACANCY STATUS | |||
| For rent Map | 12,568 | 120,490 | 4,137,567 |
| Rented, not occupied Map | 596 | 5,449 | 206,825 |
| For sale only Map | 6,564 | 64,407 | 1,896,796 |
| Sold, not occupied Map | 1,218 | 10,550 | 421,032 |
| For seasonal, recreational, or occasional use Map | 14,524 | 184,327 | 4,649,298 |
| For migrant workers Map | 49 | 538 | 24,161 |
| Other vacant Map | 8,259 | 77,775 | 3,652,759 |
| HOUSING UNITS, OCCUPIED, AVERAGE HOUSEHOLD SIZE BY TENURE | |||
| Total: Map | 2.33 | 2.63 | 2.58 |
| Owner occupied Map | 2.38 | 2.63 | 2.65 |
| Renter occupied Map | 2.22 | 2.62 | 2.44 |
| HOUSING UNITS, OCCUPIED, TENURE BY RACE OF HOUSEHOLDER | |||
| Owner occupied: Map | 214,241 | 1,571,687 | 75,986,074 |
| Householder who is White alone Map | 193,028 | 1,324,907 | 63,446,275 |
| Householder who is Black or African American alone Map | 4,136 | 36,538 | 6,261,464 |
| Householder who is American Indian and Alaska Native alone Map | 1,350 | 47,653 | 509,588 |
| Householder who is Asian alone Map | 4,517 | 35,929 | 2,688,861 |
| Householder who is Native Hawaiian and Other Pacific Islander alone Map | 238 | 1,532 | 61,911 |
| Householder who is Some Other Race alone Map | 7,576 | 99,247 | 1,975,817 |
| Householder who is Two or More Races Map | 3,396 | 25,881 | 1,042,158 |
| Renter occupied: Map | 101,998 | 809,303 | 40,730,218 |
| Householder who is White alone Map | 79,922 | 567,419 | 26,308,077 |
| Householder who is Black or African American alone Map | 6,081 | 56,456 | 7,868,519 |
| Householder who is American Indian and Alaska Native alone Map | 1,629 | 35,245 | 430,119 |
| Householder who is Asian alone Map | 2,709 | 21,665 | 1,943,303 |
| Householder who is Native Hawaiian and Other Pacific Islander alone Map | 279 | 1,911 | 82,021 |
| Householder who is Some Other Race alone Map | 7,885 | 100,851 | 2,940,610 |
| Householder who is Two or More Races Map | 3,493 | 25,756 | 1,157,569 |
| HOUSING UNITS, OCCUPIED, TENURE BY HISPANIC OR LATINO ORIGIN OF HOUSEHOLDER | |||
| Owner occupied: Map | 214,241 | 1,571,687 | 75,986,074 |
| Not Hispanic or Latino householder Map | 185,232 | 1,299,001 | 69,617,625 |
| Hispanic or Latino householder Map | 29,009 | 272,686 | 6,368,449 |
| Renter occupied: Map | 101,998 | 809,303 | 40,730,218 |
| Not Hispanic or Latino householder Map | 79,833 | 581,166 | 33,637,301 |
| Hispanic or Latino householder Map | 22,165 | 228,137 | 7,092,917 |
| HOUSING UNITS, OCCUPIED, TENURE BY HOUSEHOLD SIZE | |||
| Owner occupied: Map | 214,241 | 1,571,687 | 75,986,074 |
| 1-person household Map | 52,623 | 353,988 | 16,453,569 |
| 2-person household Map | 93,498 | 608,970 | 27,618,605 |
| 3-person household Map | 28,650 | 221,739 | 12,517,563 |
| 4-person household Map | 23,166 | 197,439 | 10,998,793 |
| 5-person household Map | 10,192 | 104,232 | 5,057,765 |
| 6-person household Map | 3,912 | 47,784 | 1,965,796 |
| 7-or-more-person household Map | 2,200 | 37,535 | 1,373,983 |
| Renter occupied: Map | 101,998 | 809,303 | 40,730,218 |
| 1-person household Map | 41,770 | 267,020 | 14,751,340 |
| 2-person household Map | 28,035 | 205,985 | 10,624,023 |
| 3-person household Map | 14,177 | 122,587 | 6,240,422 |
| 4-person household Map | 9,832 | 99,216 | 4,626,453 |
| 5-person household Map | 4,915 | 60,712 | 2,480,866 |
| 6-person household Map | 2,086 | 29,311 | 1,108,903 |
| 7-or-more-person household Map | 1,183 | 24,472 | 898,211 |
Loading...