


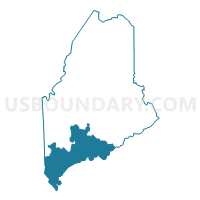
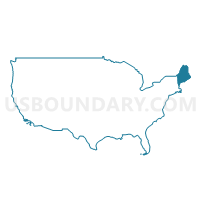
Congressional District 1, Maine
About
Outline

Summary
| Unique Area Identifier | 119091 |
| Name | Congressional District 1 |
| State | Maine |
| Area (square miles) | 5,400.36 |
| Land Area (square miles) | 3,533.91 |
| Water Area (square miles) | 1,866.45 |
| % of Land Area | 65.44 |
| % of Water Area | 34.56 |
| Latitude of the Internal Point | 43.87385380 |
| Longtitude of the Internal Point | -69.92242220 |
| Total Population | 668,515 |
| Total Housing Units | 350,913 |
| Total Households | 279,768 |
| Median Age | 42.7 |
Maps
Graphs
Select a template below for downloading or customizing gragh for Congressional District 1, Maine


Neighbors
Neighoring 111th Congressional District (by Name) Neighboring 111th Congressional District on the Map
Top 10 Neighboring County (by Population) Neighboring County on the Map
- Rockingham County, NH (295,223)
- Cumberland County, ME (281,674)
- York County, ME (197,131)
- Strafford County, NH (123,143)
- Kennebec County, ME (122,151)
- Androscoggin County, ME (107,702)
- Oxford County, ME (57,833)
- Hancock County, ME (54,418)
- Somerset County, ME (52,228)
- Carroll County, NH (47,818)
Top 10 Neighboring County Subdivision (by Population) Neighboring County Subdivision on the Map
- Portland city, Cumberland County, ME (66,194)
- Dover city, Strafford County, NH (29,987)
- Rochester city, Strafford County, NH (29,752)
- South Portland city, Cumberland County, ME (25,002)
- Auburn city, Androscoggin County, ME (23,055)
- Biddeford city, York County, ME (21,277)
- Sanford town, York County, ME (20,798)
- Portsmouth city, Rockingham County, NH (20,779)
- Brunswick town, Cumberland County, ME (20,278)
- Augusta city, Kennebec County, ME (19,136)
Top 10 Neighboring Place (by Population) Neighboring Place on the Map
- Portland city, ME (66,194)
- Dover city, NH (29,987)
- Rochester city, NH (29,752)
- South Portland city, ME (25,002)
- Auburn city, ME (23,055)
- Biddeford city, ME (21,277)
- Portsmouth city, NH (20,779)
- Augusta city, ME (19,136)
- Saco city, ME (18,482)
- Westbrook city, ME (17,494)
Top 10 Neighboring Elementary School District (by Population) Neighboring Elementary School District on the Map
- Rye School District, NH (5,298)
- Wakefield School District, NH (5,078)
- Great Salt Bay Community School District, ME (4,776)
- Rollinsford School District, NH (2,527)
- Freedom School District, NH (1,489)
- New Castle School District, NH (968)
- Newington School District, NH (753)
Top 10 Neighboring Secondary School District (by Population) Neighboring Secondary School District on the Map
Top 10 Neighboring Unified School District (by Population) Neighboring Unified School District on the Map
- Portland, ME (66,194)
- Dover School District, NH (29,987)
- Rochester School District, NH (29,752)
- Regional School Unit 23, ME (29,071)
- School Administrative District 06, ME (25,907)
- South Portland, ME (25,002)
- School Administrative District 17, ME (23,588)
- Auburn, ME (23,055)
- School Administrative District 57, ME (22,138)
- Regional School Unit 14, ME (21,437)
Top 10 Neighboring State Legislative District Lower Chamber (by Population) Neighboring State Legislative District Lower Chamber on the Map
- State House District 1, Strafford County, NH (29,752)
- State House District 3, Strafford County, NH (28,372)
- State House District 16, Rockingham County, NH (21,532)
- State House District 2, Strafford County, NH (14,293)
- State House District 128, ME (10,415)
- State House District 139, ME (10,366)
- State House District 138, ME (10,101)
- State House District 129, ME (10,087)
- State House District 97, ME (10,062)
- State House District 3, Carroll County, NH (10,016)
Top 10 Neighboring State Legislative District Upper Chamber (by Population) Neighboring State Legislative District Upper Chamber on the Map
- State Senate District 21, NH (57,893)
- State Senate District 6, NH (56,650)
- State Senate District 3, NH (56,485)
- State Senate District 24, NH (53,314)
- State Senate District 6, ME (40,612)
- State Senate District 13, ME (40,445)
- State Senate District 2, ME (40,272)
- State Senate District 3, ME (39,567)
- State Senate District 12, ME (39,339)
- State Senate District 5, ME (39,097)
Top 10 Neighboring Census Tract (by Population) Neighboring Census Tract on the Map
- Census Tract 173.01, Cumberland County, ME (8,320)
- Census Tract 200, York County, ME (8,034)
- Census Tract 25.02, Cumberland County, ME (7,819)
- Census Tract 240, York County, ME (7,693)
- Census Tract 842, Strafford County, NH (7,657)
- Census Tract 42, Cumberland County, ME (7,552)
- Census Tract 40.02, Cumberland County, ME (7,551)
- Census Tract 9704, Knox County, ME (7,532)
- Census Tract 280.02, York County, ME (7,412)
- Census Tract 320, York County, ME (7,246)
Top 10 Neighboring 5-Digit ZIP Code Tabulation Area (by Population) Neighboring 5-Digit ZIP Code Tabulation Area on the Map
- 04103, ME (30,606)
- 03820, NH (30,039)
- 04901, ME (26,248)
- 04330, ME (26,086)
- 04106, ME (25,175)
- 04005, ME (23,146)
- 04210, ME (23,045)
- 03801, NH (21,532)
- 04011, ME (20,278)
- 04074, ME (18,760)
Data
Demographic, Population, Households, and Housing Units
** Data sources from census 2010 **
Show Data on Map
Download Full List as CSV
Download Quick Sheet as CSV
| Subject | This Area | Maine | National |
|---|---|---|---|
| POPULATION | |||
| Total Population Map | 668,515 | 1,328,361 | 308,745,538 |
| POPULATION, HISPANIC OR LATINO ORIGIN | |||
| Not Hispanic or Latino Map | 659,061 | 1,311,426 | 258,267,944 |
| Hispanic or Latino Map | 9,454 | 16,935 | 50,477,594 |
| POPULATION, RACE | |||
| White alone Map | 634,969 | 1,264,971 | 223,553,265 |
| Black or African American alone Map | 8,842 | 15,707 | 38,929,319 |
| American Indian and Alaska Native alone Map | 2,275 | 8,568 | 2,932,248 |
| Asian alone Map | 9,078 | 13,571 | 14,674,252 |
| Native Hawaiian and Other Pacific Islander alone Map | 162 | 342 | 540,013 |
| Some Other Race alone Map | 2,468 | 4,261 | 19,107,368 |
| Two or More Races Map | 10,721 | 20,941 | 9,009,073 |
| POPULATION, SEX | |||
| Male Map | 325,740 | 650,056 | 151,781,326 |
| Female Map | 342,775 | 678,305 | 156,964,212 |
| POPULATION, AGE (18 YEARS) | |||
| 18 years and over Map | 529,178 | 1,053,828 | 234,564,071 |
| Under 18 years | 139,337 | 274,533 | 74,181,467 |
| POPULATION, AGE | |||
| Under 5 years | 34,678 | 69,520 | 20,201,362 |
| 5 to 9 years | 37,916 | 74,116 | 20,348,657 |
| 10 to 14 years | 40,599 | 79,013 | 20,677,194 |
| 15 to 17 years | 26,144 | 51,884 | 12,954,254 |
| 18 and 19 years | 16,337 | 36,426 | 9,086,089 |
| 20 years | 7,355 | 17,408 | 4,519,129 |
| 21 years | 7,144 | 16,566 | 4,354,294 |
| 22 to 24 years | 22,371 | 45,672 | 12,712,576 |
| 25 to 29 years | 37,361 | 72,681 | 21,101,849 |
| 30 to 34 years | 37,169 | 71,943 | 19,962,099 |
| 35 to 39 years | 41,831 | 79,905 | 20,179,642 |
| 40 to 44 years | 47,631 | 91,471 | 20,890,964 |
| 45 to 49 years | 55,566 | 107,619 | 22,708,591 |
| 50 to 54 years | 56,296 | 110,956 | 22,298,125 |
| 55 to 59 years | 51,753 | 102,441 | 19,664,805 |
| 60 and 61 years | 18,820 | 37,823 | 7,113,727 |
| 62 to 64 years | 25,798 | 51,837 | 9,704,197 |
| 65 and 66 years | 13,850 | 28,116 | 5,319,902 |
| 67 to 69 years | 18,156 | 36,898 | 7,115,361 |
| 70 to 74 years | 23,003 | 47,637 | 9,278,166 |
| 75 to 79 years | 18,546 | 38,894 | 7,317,795 |
| 80 to 84 years | 15,031 | 30,399 | 5,743,327 |
| 85 years and over | 15,160 | 29,136 | 5,493,433 |
| MEDIAN AGE BY SEX | |||
| Both sexes Map | 42.70 | 42.70 | 37.20 |
| Male Map | 41.40 | 41.50 | 35.80 |
| Female Map | 43.90 | 43.80 | 38.50 |
| HOUSEHOLDS | |||
| Total Households Map | 279,768 | 557,219 | 116,716,292 |
| HOUSEHOLDS, HOUSEHOLD TYPE | |||
| Family households: Map | 175,834 | 350,621 | 77,538,296 |
| Husband-wife family Map | 137,021 | 270,088 | 56,510,377 |
| Other family: Map | 38,813 | 80,533 | 21,027,919 |
| Male householder, no wife present Map | 11,672 | 25,085 | 5,777,570 |
| Female householder, no husband present Map | 27,141 | 55,448 | 15,250,349 |
| Nonfamily households: Map | 103,934 | 206,598 | 39,177,996 |
| Householder living alone Map | 79,699 | 159,533 | 31,204,909 |
| Householder not living alone Map | 24,235 | 47,065 | 7,973,087 |
| HOUSEHOLDS, HISPANIC OR LATINO ORIGIN OF HOUSEHOLDER | |||
| Not Hispanic or Latino householder: Map | 277,183 | 552,753 | 103,254,926 |
| Hispanic or Latino householder: Map | 2,585 | 4,466 | 13,461,366 |
| HOUSEHOLDS, RACE OF HOUSEHOLDER | |||
| Householder who is White alone | 270,175 | 538,973 | 89,754,352 |
| Householder who is Black or African American alone | 2,604 | 4,260 | 14,129,983 |
| Householder who is American Indian and Alaska Native alone | 917 | 3,316 | 939,707 |
| Householder who is Asian alone | 2,498 | 3,655 | 4,632,164 |
| Householder who is Native Hawaiian and Other Pacific Islander alone | 43 | 98 | 143,932 |
| Householder who is Some Other Race alone | 647 | 1,129 | 4,916,427 |
| Householder who is Two or More Races | 2,884 | 5,788 | 2,199,727 |
| HOUSEHOLDS, HOUSEHOLD TYPE BY HOUSEHOLD SIZE | |||
| Family households: Map | 175,834 | 350,621 | 77,538,296 |
| 2-person household Map | 85,119 | 173,649 | 31,882,616 |
| 3-person household Map | 40,468 | 79,656 | 17,765,829 |
| 4-person household Map | 32,574 | 62,338 | 15,214,075 |
| 5-person household Map | 11,842 | 23,357 | 7,411,997 |
| 6-person household Map | 3,947 | 7,746 | 3,026,278 |
| 7-or-more-person household Map | 1,884 | 3,875 | 2,237,501 |
| Nonfamily households: Map | 103,934 | 206,598 | 39,177,996 |
| 1-person household Map | 79,699 | 159,533 | 31,204,909 |
| 2-person household Map | 20,673 | 40,046 | 6,360,012 |
| 3-person household Map | 2,458 | 4,684 | 992,156 |
| 4-person household Map | 794 | 1,672 | 411,171 |
| 5-person household Map | 230 | 483 | 126,634 |
| 6-person household Map | 48 | 108 | 48,421 |
| 7-or-more-person household Map | 32 | 72 | 34,693 |
| HOUSING UNITS | |||
| Total Housing Units Map | 350,913 | 721,830 | 131,704,730 |
| HOUSING UNITS, OCCUPANCY STATUS | |||
| Occupied Map | 279,768 | 557,219 | 116,716,292 |
| Vacant Map | 71,145 | 164,611 | 14,988,438 |
| HOUSING UNITS, OCCUPIED, TENURE | |||
| Owned with a mortgage or a loan Map | 141,714 | 264,218 | 52,979,430 |
| Owned free and clear Map | 57,381 | 133,199 | 23,006,644 |
| Renter occupied Map | 80,673 | 159,802 | 40,730,218 |
| HOUSING UNITS, VACANT, VACANCY STATUS | |||
| For rent Map | 7,649 | 15,738 | 4,137,567 |
| Rented, not occupied Map | 486 | 1,021 | 206,825 |
| For sale only Map | 4,271 | 9,711 | 1,896,796 |
| Sold, not occupied Map | 922 | 2,089 | 421,032 |
| For seasonal, recreational, or occasional use Map | 51,344 | 118,310 | 4,649,298 |
| For migrant workers Map | 20 | 160 | 24,161 |
| Other vacant Map | 6,453 | 17,582 | 3,652,759 |
| HOUSING UNITS, OCCUPIED, AVERAGE HOUSEHOLD SIZE BY TENURE | |||
| Total: Map | 2.33 | 2.32 | 2.58 |
| Owner occupied Map | 2.46 | 2.43 | 2.65 |
| Renter occupied Map | 2.03 | 2.04 | 2.44 |
| HOUSING UNITS, OCCUPIED, TENURE BY RACE OF HOUSEHOLDER | |||
| Owner occupied: Map | 199,095 | 397,417 | 75,986,074 |
| Householder who is White alone Map | 195,123 | 389,341 | 63,446,275 |
| Householder who is Black or African American alone Map | 655 | 1,026 | 6,261,464 |
| Householder who is American Indian and Alaska Native alone Map | 436 | 1,720 | 509,588 |
| Householder who is Asian alone Map | 1,281 | 1,943 | 2,688,861 |
| Householder who is Native Hawaiian and Other Pacific Islander alone Map | 16 | 40 | 61,911 |
| Householder who is Some Other Race alone Map | 228 | 437 | 1,975,817 |
| Householder who is Two or More Races Map | 1,356 | 2,910 | 1,042,158 |
| Renter occupied: Map | 80,673 | 159,802 | 40,730,218 |
| Householder who is White alone Map | 75,052 | 149,632 | 26,308,077 |
| Householder who is Black or African American alone Map | 1,949 | 3,234 | 7,868,519 |
| Householder who is American Indian and Alaska Native alone Map | 481 | 1,596 | 430,119 |
| Householder who is Asian alone Map | 1,217 | 1,712 | 1,943,303 |
| Householder who is Native Hawaiian and Other Pacific Islander alone Map | 27 | 58 | 82,021 |
| Householder who is Some Other Race alone Map | 419 | 692 | 2,940,610 |
| Householder who is Two or More Races Map | 1,528 | 2,878 | 1,157,569 |
| HOUSING UNITS, OCCUPIED, TENURE BY HISPANIC OR LATINO ORIGIN OF HOUSEHOLDER | |||
| Owner occupied: Map | 199,095 | 397,417 | 75,986,074 |
| Not Hispanic or Latino householder Map | 197,904 | 395,316 | 69,617,625 |
| Hispanic or Latino householder Map | 1,191 | 2,101 | 6,368,449 |
| Renter occupied: Map | 80,673 | 159,802 | 40,730,218 |
| Not Hispanic or Latino householder Map | 79,279 | 157,437 | 33,637,301 |
| Hispanic or Latino householder Map | 1,394 | 2,365 | 7,092,917 |
| HOUSING UNITS, OCCUPIED, TENURE BY HOUSEHOLD SIZE | |||
| Owner occupied: Map | 199,095 | 397,417 | 75,986,074 |
| 1-person household Map | 43,603 | 88,150 | 16,453,569 |
| 2-person household Map | 82,449 | 168,126 | 27,618,605 |
| 3-person household Map | 32,214 | 62,975 | 12,517,563 |
| 4-person household Map | 26,970 | 51,019 | 10,998,793 |
| 5-person household Map | 9,435 | 18,438 | 5,057,765 |
| 6-person household Map | 3,055 | 5,953 | 1,965,796 |
| 7-or-more-person household Map | 1,369 | 2,756 | 1,373,983 |
| Renter occupied: Map | 80,673 | 159,802 | 40,730,218 |
| 1-person household Map | 36,096 | 71,383 | 14,751,340 |
| 2-person household Map | 23,343 | 45,569 | 10,624,023 |
| 3-person household Map | 10,712 | 21,365 | 6,240,422 |
| 4-person household Map | 6,398 | 12,991 | 4,626,453 |
| 5-person household Map | 2,637 | 5,402 | 2,480,866 |
| 6-person household Map | 940 | 1,901 | 1,108,903 |
| 7-or-more-person household Map | 547 | 1,191 | 898,211 |
Loading...