


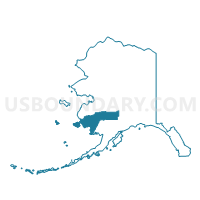
Census Tract 1, Bethel Census Area, Alaska
About
Outline

Summary
| Unique Area Identifier | 432865 |
| Name | Census Tract 1 |
| County | Bethel Census Area |
| State | Alaska |
| Area (square miles) | 25,995.04 |
| Land Area (square miles) | 21,313.29 |
| Water Area (square miles) | 4,681.75 |
| % of Land Area | 81.99 |
| % of Water Area | 18.01 |
| Latitude of the Internal Point | 60.41229090 |
| Longtitude of the Internal Point | -162.66875950 |
| Total Population | 9,483 |
| Total Housing Units | 2,805 |
| Total Households | 2,286 |
| Median Age | 24 |
Maps

Graphs
Select a template below for downloading or customizing gragh for Census Tract 1, Bethel Census Area, Alaska


Neighbors
Neighoring Census Tract (by Name) Neighboring Census Tract on the Map
- Census Tract 1, Wade Hampton Census Area, AK
- Census Tract 1, Dillingham Census Area, AK
- Census Tract 2, Bethel Census Area, AK
- Census Tract 3, Bethel Census Area, AK
Top 10 Neighboring County Subdivision (by Population) Neighboring County Subdivision on the Map
- Lower Kuskokwim census subarea, Bethel Census Area, AK (15,563)
- Wade Hampton census subarea, Wade Hampton Census Area, AK (7,459)
- Dillingham census subarea, Dillingham Census Area, AK (4,847)
- Aniak census subarea, Bethel Census Area, AK (1,450)
Top 10 Neighboring Place (by Population) Neighboring Place on the Map
- Bethel city, AK (6,080)
- Kwethluk city, AK (721)
- Quinhagak city, AK (669)
- Kipnuk CDP, AK (639)
- Akiachak CDP, AK (627)
- Toksook Bay city, AK (590)
- Kasigluk CDP, AK (569)
- Nunapitchuk city, AK (496)
- Kongiganak CDP, AK (439)
- Chefornak city, AK (418)
Top 10 Neighboring Unified School District (by Population) Neighboring Unified School District on the Map
- Lower Kuskokwim School District, AK (14,217)
- Lower Yukon School District, AK (6,014)
- Southwest Region School District, AK (2,518)
- Kuspuk School District, AK (1,406)
- Yupiit School District, AK (1,346)
Top 10 Neighboring State Legislative District Lower Chamber (by Population) Neighboring State Legislative District Lower Chamber on the Map
- State House District 38, Bethel, AK (16,055)
- State House District 39, Bering Straits, AK (15,642)
- State House District 37, Bristol Bay-Aleutians, AK (15,199)
- State House District 6, Interior Villages, AK (14,235)
Top 10 Neighboring State Legislative District Upper Chamber (by Population) Neighboring State Legislative District Upper Chamber on the Map
- State Senate District T, AK (33,158)
- State Senate District S, AK (31,254)
- State Senate District C, AK (28,081)
Top 10 Neighboring 111th Congressional District (by Population) Neighboring 111th Congressional District on the Map
Top 10 Neighboring 5-Digit ZIP Code Tabulation Area (by Population) Neighboring 5-Digit ZIP Code Tabulation Area on the Map
- 99559, AK (7,632)
- 99576, AK (2,603)
- 99678, AK (891)
- 99557, AK (726)
- 99621, AK (723)
- 99655, AK (669)
- 99614, AK (639)
- 99551, AK (627)
- 99637, AK (590)
- 99609, AK (569)
Data
Demographic, Population, Households, and Housing Units
** Data sources from census 2010 **
Show Data on Map
Download Full List as CSV
Download Quick Sheet as CSV
| Subject | This Area | Bethel Census Area | Alaska | National |
|---|---|---|---|---|
| POPULATION | ||||
| Total Population Map | 9,483 | 17,013 | 710,231 | 308,745,538 |
| POPULATION, HISPANIC OR LATINO ORIGIN | ||||
| Not Hispanic or Latino Map | 9,448 | 16,832 | 670,982 | 258,267,944 |
| Hispanic or Latino Map | 35 | 181 | 39,249 | 50,477,594 |
| POPULATION, RACE | ||||
| White alone Map | 301 | 1,894 | 473,576 | 223,553,265 |
| Black or African American alone Map | 7 | 65 | 23,263 | 38,929,319 |
| American Indian and Alaska Native alone Map | 9,009 | 14,109 | 104,871 | 2,932,248 |
| Asian alone Map | 6 | 160 | 38,135 | 14,674,252 |
| Native Hawaiian and Other Pacific Islander alone Map | 3 | 27 | 7,409 | 540,013 |
| Some Other Race alone Map | 7 | 45 | 11,102 | 19,107,368 |
| Two or More Races Map | 150 | 713 | 51,875 | 9,009,073 |
| POPULATION, SEX | ||||
| Male Map | 4,990 | 8,898 | 369,628 | 151,781,326 |
| Female Map | 4,493 | 8,115 | 340,603 | 156,964,212 |
| POPULATION, AGE (18 YEARS) | ||||
| 18 years and over Map | 5,737 | 10,795 | 522,853 | 234,564,071 |
| Under 18 years | 3,746 | 6,218 | 187,378 | 74,181,467 |
| POPULATION, AGE | ||||
| Under 5 years | 1,047 | 1,796 | 53,996 | 20,201,362 |
| 5 to 9 years | 1,080 | 1,762 | 50,887 | 20,348,657 |
| 10 to 14 years | 1,021 | 1,669 | 50,816 | 20,677,194 |
| 15 to 17 years | 598 | 991 | 31,679 | 12,954,254 |
| 18 and 19 years | 380 | 627 | 20,462 | 9,086,089 |
| 20 years | 167 | 304 | 10,628 | 4,519,129 |
| 21 years | 142 | 249 | 10,577 | 4,354,294 |
| 22 to 24 years | 454 | 796 | 33,214 | 12,712,576 |
| 25 to 29 years | 606 | 1,210 | 55,419 | 21,101,849 |
| 30 to 34 years | 539 | 1,047 | 47,706 | 19,962,099 |
| 35 to 39 years | 475 | 893 | 45,833 | 20,179,642 |
| 40 to 44 years | 506 | 965 | 47,141 | 20,890,964 |
| 45 to 49 years | 597 | 1,162 | 54,726 | 22,708,591 |
| 50 to 54 years | 486 | 1,048 | 56,300 | 22,298,125 |
| 55 to 59 years | 431 | 850 | 49,971 | 19,664,805 |
| 60 and 61 years | 143 | 281 | 16,471 | 7,113,727 |
| 62 to 64 years | 151 | 322 | 19,467 | 9,704,197 |
| 65 and 66 years | 116 | 198 | 10,103 | 5,319,902 |
| 67 to 69 years | 166 | 253 | 12,099 | 7,115,361 |
| 70 to 74 years | 136 | 213 | 13,148 | 9,278,166 |
| 75 to 79 years | 127 | 194 | 8,892 | 7,317,795 |
| 80 to 84 years | 75 | 114 | 5,985 | 5,743,327 |
| 85 years and over | 40 | 69 | 4,711 | 5,493,433 |
| MEDIAN AGE BY SEX | ||||
| Both sexes Map | 24.00 | 26.20 | 33.80 | 37.20 |
| Male Map | 24.50 | 26.70 | 33.60 | 35.80 |
| Female Map | 23.50 | 25.70 | 34.10 | 38.50 |
| HOUSEHOLDS | ||||
| Total Households Map | 2,286 | 4,651 | 258,058 | 116,716,292 |
| HOUSEHOLDS, HOUSEHOLD TYPE | ||||
| Family households: Map | 1,858 | 3,436 | 170,750 | 77,538,296 |
| Husband-wife family Map | 1,145 | 2,112 | 127,558 | 56,510,377 |
| Other family: Map | 713 | 1,324 | 43,192 | 21,027,919 |
| Male householder, no wife present Map | 293 | 526 | 15,455 | 5,777,570 |
| Female householder, no husband present Map | 420 | 798 | 27,737 | 15,250,349 |
| Nonfamily households: Map | 428 | 1,215 | 87,308 | 39,177,996 |
| Householder living alone Map | 356 | 939 | 66,073 | 31,204,909 |
| Householder not living alone Map | 72 | 276 | 21,235 | 7,973,087 |
| HOUSEHOLDS, HISPANIC OR LATINO ORIGIN OF HOUSEHOLDER | ||||
| Not Hispanic or Latino householder: Map | 2,281 | 4,600 | 247,802 | 103,254,926 |
| Hispanic or Latino householder: Map | 5 | 51 | 10,256 | 13,461,366 |
| HOUSEHOLDS, RACE OF HOUSEHOLDER | ||||
| Householder who is White alone | 160 | 992 | 193,099 | 89,754,352 |
| Householder who is Black or African American alone | 4 | 37 | 8,431 | 14,129,983 |
| Householder who is American Indian and Alaska Native alone | 2,096 | 3,388 | 30,342 | 939,707 |
| Householder who is Asian alone | 2 | 69 | 9,710 | 4,632,164 |
| Householder who is Native Hawaiian and Other Pacific Islander alone | 0 | 8 | 1,686 | 143,932 |
| Householder who is Some Other Race alone | 1 | 16 | 3,330 | 4,916,427 |
| Householder who is Two or More Races | 23 | 141 | 11,460 | 2,199,727 |
| HOUSEHOLDS, HOUSEHOLD TYPE BY HOUSEHOLD SIZE | ||||
| Family households: Map | 1,858 | 3,436 | 170,750 | 77,538,296 |
| 2-person household Map | 258 | 679 | 66,531 | 31,882,616 |
| 3-person household Map | 260 | 591 | 39,241 | 17,765,829 |
| 4-person household Map | 310 | 653 | 33,269 | 15,214,075 |
| 5-person household Map | 535 | 755 | 17,872 | 7,411,997 |
| 6-person household Map | 159 | 292 | 7,452 | 3,026,278 |
| 7-or-more-person household Map | 336 | 466 | 6,385 | 2,237,501 |
| Nonfamily households: Map | 428 | 1,215 | 87,308 | 39,177,996 |
| 1-person household Map | 356 | 939 | 66,073 | 31,204,909 |
| 2-person household Map | 59 | 228 | 17,321 | 6,360,012 |
| 3-person household Map | 8 | 28 | 2,650 | 992,156 |
| 4-person household Map | 4 | 12 | 855 | 411,171 |
| 5-person household Map | 0 | 4 | 250 | 126,634 |
| 6-person household Map | 1 | 3 | 94 | 48,421 |
| 7-or-more-person household Map | 0 | 1 | 65 | 34,693 |
| HOUSING UNITS | ||||
| Total Housing Units Map | 2,805 | 5,919 | 306,967 | 131,704,730 |
| HOUSING UNITS, OCCUPANCY STATUS | ||||
| Occupied Map | 2,286 | 4,651 | 258,058 | 116,716,292 |
| Vacant Map | 519 | 1,268 | 48,909 | 14,988,438 |
| HOUSING UNITS, OCCUPIED, TENURE | ||||
| Owned with a mortgage or a loan Map | 233 | 856 | 112,012 | 52,979,430 |
| Owned free and clear Map | 1,331 | 1,846 | 50,753 | 23,006,644 |
| Renter occupied Map | 722 | 1,949 | 95,293 | 40,730,218 |
| HOUSING UNITS, VACANT, VACANCY STATUS | ||||
| For rent Map | 39 | 178 | 6,729 | 4,137,567 |
| Rented, not occupied Map | 8 | 19 | 667 | 206,825 |
| For sale only Map | 0 | 24 | 2,876 | 1,896,796 |
| Sold, not occupied Map | 0 | 20 | 1,006 | 421,032 |
| For seasonal, recreational, or occasional use Map | 293 | 616 | 27,901 | 4,649,298 |
| For migrant workers Map | 7 | 14 | 362 | 24,161 |
| Other vacant Map | 172 | 397 | 9,368 | 3,652,759 |
| HOUSING UNITS, OCCUPIED, AVERAGE HOUSEHOLD SIZE BY TENURE | ||||
| Total: Map | 4.14 | 3.59 | 2.65 | 2.58 |
| Owner occupied Map | 4.29 | 3.88 | 2.76 | 2.65 |
| Renter occupied Map | 3.82 | 3.17 | 2.47 | 2.44 |
| HOUSING UNITS, OCCUPIED, TENURE BY RACE OF HOUSEHOLDER | ||||
| Owner occupied: Map | 1,564 | 2,702 | 162,765 | 75,986,074 |
| Householder who is White alone Map | 11 | 398 | 129,210 | 63,446,275 |
| Householder who is Black or African American alone Map | 3 | 14 | 3,060 | 6,261,464 |
| Householder who is American Indian and Alaska Native alone Map | 1,536 | 2,188 | 17,310 | 509,588 |
| Householder who is Asian alone Map | 1 | 25 | 5,345 | 2,688,861 |
| Householder who is Native Hawaiian and Other Pacific Islander alone Map | 0 | 5 | 513 | 61,911 |
| Householder who is Some Other Race alone Map | 1 | 4 | 1,506 | 1,975,817 |
| Householder who is Two or More Races Map | 12 | 68 | 5,821 | 1,042,158 |
| Renter occupied: Map | 722 | 1,949 | 95,293 | 40,730,218 |
| Householder who is White alone Map | 149 | 594 | 63,889 | 26,308,077 |
| Householder who is Black or African American alone Map | 1 | 23 | 5,371 | 7,868,519 |
| Householder who is American Indian and Alaska Native alone Map | 560 | 1,200 | 13,032 | 430,119 |
| Householder who is Asian alone Map | 1 | 44 | 4,365 | 1,943,303 |
| Householder who is Native Hawaiian and Other Pacific Islander alone Map | 0 | 3 | 1,173 | 82,021 |
| Householder who is Some Other Race alone Map | 0 | 12 | 1,824 | 2,940,610 |
| Householder who is Two or More Races Map | 11 | 73 | 5,639 | 1,157,569 |
| HOUSING UNITS, OCCUPIED, TENURE BY HISPANIC OR LATINO ORIGIN OF HOUSEHOLDER | ||||
| Owner occupied: Map | 1,564 | 2,702 | 162,765 | 75,986,074 |
| Not Hispanic or Latino householder Map | 1,560 | 2,679 | 157,925 | 69,617,625 |
| Hispanic or Latino householder Map | 4 | 23 | 4,840 | 6,368,449 |
| Renter occupied: Map | 722 | 1,949 | 95,293 | 40,730,218 |
| Not Hispanic or Latino householder Map | 721 | 1,921 | 89,877 | 33,637,301 |
| Hispanic or Latino householder Map | 1 | 28 | 5,416 | 7,092,917 |
| HOUSING UNITS, OCCUPIED, TENURE BY HOUSEHOLD SIZE | ||||
| Owner occupied: Map | 1,564 | 2,702 | 162,765 | 75,986,074 |
| 1-person household Map | 226 | 439 | 33,371 | 16,453,569 |
| 2-person household Map | 200 | 477 | 57,619 | 27,618,605 |
| 3-person household Map | 189 | 373 | 27,211 | 12,517,563 |
| 4-person household Map | 221 | 411 | 23,189 | 10,998,793 |
| 5-person household Map | 352 | 471 | 11,981 | 5,057,765 |
| 6-person household Map | 110 | 189 | 5,011 | 1,965,796 |
| 7-or-more-person household Map | 266 | 342 | 4,383 | 1,373,983 |
| Renter occupied: Map | 722 | 1,949 | 95,293 | 40,730,218 |
| 1-person household Map | 130 | 500 | 32,702 | 14,751,340 |
| 2-person household Map | 117 | 430 | 26,233 | 10,624,023 |
| 3-person household Map | 79 | 246 | 14,680 | 6,240,422 |
| 4-person household Map | 93 | 254 | 10,935 | 4,626,453 |
| 5-person household Map | 183 | 288 | 6,141 | 2,480,866 |
| 6-person household Map | 50 | 106 | 2,535 | 1,108,903 |
| 7-or-more-person household Map | 70 | 125 | 2,067 | 898,211 |
Loading...