


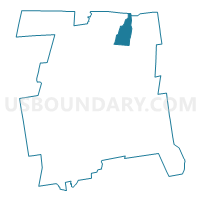
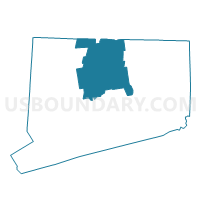
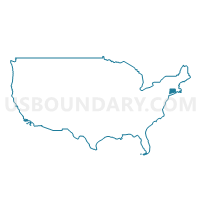
Census Tract 4771.02, Hartford County, Connecticut
About
Outline

Summary
| Unique Area Identifier | 444903 |
| Name | Census Tract 4771.02 |
| County | Hartford County |
| State | Connecticut |
| Area (square miles) | 11.23 |
| Land Area (square miles) | 10.63 |
| Water Area (square miles) | 0.61 |
| % of Land Area | 94.60 |
| % of Water Area | 5.40 |
| Latitude of the Internal Point | 41.97064490 |
| Longtitude of the Internal Point | -72.62932800 |
| Total Population | 8,521 |
| Total Housing Units | 2,551 |
| Total Households | 2,418 |
| Median Age | 39.4 |
Maps
Graphs
Select a template below for downloading or customizing gragh for Census Tract 4771.02, Hartford County, Connecticut


Neighbors
Neighoring Census Tract (by Name) Neighboring Census Tract on the Map
- Census Tract 4761, Hartford County, CT
- Census Tract 4763, Hartford County, CT
- Census Tract 4771.01, Hartford County, CT
- Census Tract 4805, Hartford County, CT
- Census Tract 4806, Hartford County, CT
- Census Tract 4807, Hartford County, CT
- Census Tract 4812, Hartford County, CT
- Census Tract 4813, Hartford County, CT
- Census Tract 8132.05, Hampden County, MA
- Census Tract 8132.08, Hampden County, MA
- Census Tract 8133.01, Hampden County, MA
Top 10 Neighboring County Subdivision (by Population) Neighboring County Subdivision on the Map
- Enfield town, Hartford County, CT (44,654)
- Agawam Town city, Hampden County, MA (28,438)
- Longmeadow town, Hampden County, MA (15,784)
- Suffield town, Hartford County, CT (15,735)
- Windsor Locks town, Hartford County, CT (12,498)
Top 10 Neighboring Place (by Population) Neighboring Place on the Map
- Agawam Town city, MA (28,438)
- Longmeadow CDP, MA (15,784)
- Windsor Locks CDP, CT (12,498)
- Thompsonville CDP, CT (8,577)
- Suffield Depot CDP, CT (1,325)
Top 10 Neighboring Unified School District (by Population) Neighboring Unified School District on the Map
- Enfield School District, CT (44,654)
- Agawam School District, MA (28,438)
- Longmeadow School District, MA (15,784)
- Suffield School District, CT (15,735)
- Windsor Locks School District, CT (12,498)
Top 10 Neighboring State Legislative District Lower Chamber (by Population) Neighboring State Legislative District Lower Chamber on the Map
- Second Hampden District, MA (42,757)
- Third Hampden District, MA (41,281)
- State House District 61, CT (24,674)
- State House District 60, CT (23,028)
- State House District 58, CT (22,608)
Top 10 Neighboring State Legislative District Upper Chamber (by Population) Neighboring State Legislative District Upper Chamber on the Map
- First Hampden & Hampshire District, MA (158,884)
- Hampden District, MA (155,199)
- State Senate District 7, CT (100,005)
Top 10 Neighboring 111th Congressional District (by Population) Neighboring 111th Congressional District on the Map
- Congressional District 2, CT (729,771)
- Congressional District 1, CT (710,951)
- Congressional District 2, MA (661,045)
Top 10 Neighboring 5-Digit ZIP Code Tabulation Area (by Population) Neighboring 5-Digit ZIP Code Tabulation Area on the Map
Explore Neighbors on the MapData
Demographic, Population, Households, and Housing Units
** Data sources from census 2010 **
Show Data on Map
Download Full List as CSV
Download Quick Sheet as CSV
| Subject | This Area | Hartford County | Connecticut | National |
|---|---|---|---|---|
| POPULATION | ||||
| Total Population Map | 8,521 | 894,014 | 3,574,097 | 308,745,538 |
| POPULATION, HISPANIC OR LATINO ORIGIN | ||||
| Not Hispanic or Latino Map | 7,758 | 757,231 | 3,095,010 | 258,267,944 |
| Hispanic or Latino Map | 763 | 136,783 | 479,087 | 50,477,594 |
| POPULATION, RACE | ||||
| White alone Map | 6,545 | 647,237 | 2,772,410 | 223,553,265 |
| Black or African American alone Map | 1,150 | 119,191 | 362,296 | 38,929,319 |
| American Indian and Alaska Native alone Map | 16 | 2,387 | 11,256 | 2,932,248 |
| Asian alone Map | 138 | 37,958 | 135,565 | 14,674,252 |
| Native Hawaiian and Other Pacific Islander alone Map | 3 | 289 | 1,428 | 540,013 |
| Some Other Race alone Map | 579 | 63,058 | 198,466 | 19,107,368 |
| Two or More Races Map | 90 | 23,894 | 92,676 | 9,009,073 |
| POPULATION, SEX | ||||
| Male Map | 5,203 | 432,013 | 1,739,614 | 151,781,326 |
| Female Map | 3,318 | 462,001 | 1,834,483 | 156,964,212 |
| POPULATION, AGE (18 YEARS) | ||||
| 18 years and over Map | 7,096 | 689,971 | 2,757,082 | 234,564,071 |
| Under 18 years | 1,425 | 204,043 | 817,015 | 74,181,467 |
| POPULATION, AGE | ||||
| Under 5 years | 273 | 50,688 | 202,106 | 20,201,362 |
| 5 to 9 years | 425 | 55,456 | 222,571 | 20,348,657 |
| 10 to 14 years | 447 | 59,734 | 240,265 | 20,677,194 |
| 15 to 17 years | 280 | 38,165 | 152,073 | 12,954,254 |
| 18 and 19 years | 332 | 23,519 | 98,761 | 9,086,089 |
| 20 years | 137 | 11,167 | 48,139 | 4,519,129 |
| 21 years | 133 | 10,764 | 46,335 | 4,354,294 |
| 22 to 24 years | 424 | 33,771 | 133,424 | 12,712,576 |
| 25 to 29 years | 644 | 56,690 | 214,145 | 21,101,849 |
| 30 to 34 years | 587 | 52,995 | 206,232 | 19,962,099 |
| 35 to 39 years | 672 | 55,386 | 222,401 | 20,179,642 |
| 40 to 44 years | 728 | 63,410 | 262,037 | 20,890,964 |
| 45 to 49 years | 786 | 71,246 | 291,272 | 22,708,591 |
| 50 to 54 years | 676 | 70,008 | 284,325 | 22,298,125 |
| 55 to 59 years | 485 | 59,788 | 240,157 | 19,664,805 |
| 60 and 61 years | 159 | 21,227 | 84,356 | 7,113,727 |
| 62 to 64 years | 229 | 29,881 | 118,939 | 9,704,197 |
| 65 and 66 years | 132 | 15,857 | 64,434 | 5,319,902 |
| 67 to 69 years | 165 | 20,976 | 84,847 | 7,115,361 |
| 70 to 74 years | 217 | 26,920 | 105,663 | 9,278,166 |
| 75 to 79 years | 197 | 23,251 | 89,252 | 7,317,795 |
| 80 to 84 years | 157 | 20,378 | 77,465 | 5,743,327 |
| 85 years and over | 236 | 22,737 | 84,898 | 5,493,433 |
| MEDIAN AGE BY SEX | ||||
| Both sexes Map | 39.40 | 39.90 | 40.00 | 37.20 |
| Male Map | 36.50 | 38.20 | 38.50 | 35.80 |
| Female Map | 44.80 | 41.40 | 41.30 | 38.50 |
| HOUSEHOLDS | ||||
| Total Households Map | 2,418 | 350,854 | 1,371,087 | 116,716,292 |
| HOUSEHOLDS, HOUSEHOLD TYPE | ||||
| Family households: Map | 1,638 | 227,831 | 908,661 | 77,538,296 |
| Husband-wife family Map | 1,336 | 161,327 | 672,013 | 56,510,377 |
| Other family: Map | 302 | 66,504 | 236,648 | 21,027,919 |
| Male householder, no wife present Map | 91 | 15,596 | 59,675 | 5,777,570 |
| Female householder, no husband present Map | 211 | 50,908 | 176,973 | 15,250,349 |
| Nonfamily households: Map | 780 | 123,023 | 462,426 | 39,177,996 |
| Householder living alone Map | 658 | 100,524 | 373,648 | 31,204,909 |
| Householder not living alone Map | 122 | 22,499 | 88,778 | 7,973,087 |
| HOUSEHOLDS, HISPANIC OR LATINO ORIGIN OF HOUSEHOLDER | ||||
| Not Hispanic or Latino householder: Map | 2,375 | 309,482 | 1,234,310 | 103,254,926 |
| Hispanic or Latino householder: Map | 43 | 41,372 | 136,777 | 13,461,366 |
| HOUSEHOLDS, RACE OF HOUSEHOLDER | ||||
| Householder who is White alone | 2,302 | 270,264 | 1,118,798 | 89,754,352 |
| Householder who is Black or African American alone | 48 | 42,483 | 126,729 | 14,129,983 |
| Householder who is American Indian and Alaska Native alone | 3 | 820 | 3,856 | 939,707 |
| Householder who is Asian alone | 37 | 11,805 | 41,812 | 4,632,164 |
| Householder who is Native Hawaiian and Other Pacific Islander alone | 1 | 89 | 406 | 143,932 |
| Householder who is Some Other Race alone | 10 | 19,399 | 57,489 | 4,916,427 |
| Householder who is Two or More Races | 17 | 5,994 | 21,997 | 2,199,727 |
| HOUSEHOLDS, HOUSEHOLD TYPE BY HOUSEHOLD SIZE | ||||
| Family households: Map | 1,638 | 227,831 | 908,661 | 77,538,296 |
| 2-person household Map | 692 | 94,297 | 369,216 | 31,882,616 |
| 3-person household Map | 373 | 55,121 | 217,411 | 17,765,829 |
| 4-person household Map | 362 | 47,693 | 193,491 | 15,214,075 |
| 5-person household Map | 161 | 20,256 | 83,677 | 7,411,997 |
| 6-person household Map | 35 | 6,827 | 28,907 | 3,026,278 |
| 7-or-more-person household Map | 15 | 3,637 | 15,959 | 2,237,501 |
| Nonfamily households: Map | 780 | 123,023 | 462,426 | 39,177,996 |
| 1-person household Map | 658 | 100,524 | 373,648 | 31,204,909 |
| 2-person household Map | 109 | 19,064 | 73,879 | 6,360,012 |
| 3-person household Map | 9 | 2,401 | 9,247 | 992,156 |
| 4-person household Map | 2 | 717 | 3,625 | 411,171 |
| 5-person household Map | 2 | 215 | 1,239 | 126,634 |
| 6-person household Map | 0 | 56 | 441 | 48,421 |
| 7-or-more-person household Map | 0 | 46 | 347 | 34,693 |
| HOUSING UNITS | ||||
| Total Housing Units Map | 2,551 | 374,249 | 1,487,891 | 131,704,730 |
| HOUSING UNITS, OCCUPANCY STATUS | ||||
| Occupied Map | 2,418 | 350,854 | 1,371,087 | 116,716,292 |
| Vacant Map | 133 | 23,395 | 116,804 | 14,988,438 |
| HOUSING UNITS, OCCUPIED, TENURE | ||||
| Owned with a mortgage or a loan Map | 1,513 | 167,361 | 680,960 | 52,979,430 |
| Owned free and clear Map | 491 | 62,559 | 244,326 | 23,006,644 |
| Renter occupied Map | 414 | 120,934 | 445,801 | 40,730,218 |
| HOUSING UNITS, VACANT, VACANCY STATUS | ||||
| For rent Map | 12 | 10,519 | 40,004 | 4,137,567 |
| Rented, not occupied Map | 0 | 403 | 1,960 | 206,825 |
| For sale only Map | 31 | 3,197 | 15,564 | 1,896,796 |
| Sold, not occupied Map | 7 | 758 | 3,729 | 421,032 |
| For seasonal, recreational, or occasional use Map | 30 | 2,374 | 29,618 | 4,649,298 |
| For migrant workers Map | 0 | 14 | 55 | 24,161 |
| Other vacant Map | 53 | 6,130 | 25,874 | 3,652,759 |
| HOUSING UNITS, OCCUPIED, AVERAGE HOUSEHOLD SIZE BY TENURE | ||||
| Total: Map | 2.48 | 2.47 | 2.52 | 2.58 |
| Owner occupied Map | 2.61 | 2.59 | 2.64 | 2.65 |
| Renter occupied Map | 1.86 | 2.23 | 2.27 | 2.44 |
| HOUSING UNITS, OCCUPIED, TENURE BY RACE OF HOUSEHOLDER | ||||
| Owner occupied: Map | 2,004 | 229,920 | 925,286 | 75,986,074 |
| Householder who is White alone Map | 1,909 | 198,544 | 825,201 | 63,446,275 |
| Householder who is Black or African American alone Map | 40 | 17,836 | 50,482 | 6,261,464 |
| Householder who is American Indian and Alaska Native alone Map | 3 | 308 | 1,726 | 509,588 |
| Householder who is Asian alone Map | 34 | 6,281 | 23,507 | 2,688,861 |
| Householder who is Native Hawaiian and Other Pacific Islander alone Map | 0 | 36 | 172 | 61,911 |
| Householder who is Some Other Race alone Map | 7 | 4,415 | 14,728 | 1,975,817 |
| Householder who is Two or More Races Map | 11 | 2,500 | 9,470 | 1,042,158 |
| Renter occupied: Map | 414 | 120,934 | 445,801 | 40,730,218 |
| Householder who is White alone Map | 393 | 71,720 | 293,597 | 26,308,077 |
| Householder who is Black or African American alone Map | 8 | 24,647 | 76,247 | 7,868,519 |
| Householder who is American Indian and Alaska Native alone Map | 0 | 512 | 2,130 | 430,119 |
| Householder who is Asian alone Map | 3 | 5,524 | 18,305 | 1,943,303 |
| Householder who is Native Hawaiian and Other Pacific Islander alone Map | 1 | 53 | 234 | 82,021 |
| Householder who is Some Other Race alone Map | 3 | 14,984 | 42,761 | 2,940,610 |
| Householder who is Two or More Races Map | 6 | 3,494 | 12,527 | 1,157,569 |
| HOUSING UNITS, OCCUPIED, TENURE BY HISPANIC OR LATINO ORIGIN OF HOUSEHOLDER | ||||
| Owner occupied: Map | 2,004 | 229,920 | 925,286 | 75,986,074 |
| Not Hispanic or Latino householder Map | 1,972 | 217,866 | 879,820 | 69,617,625 |
| Hispanic or Latino householder Map | 32 | 12,054 | 45,466 | 6,368,449 |
| Renter occupied: Map | 414 | 120,934 | 445,801 | 40,730,218 |
| Not Hispanic or Latino householder Map | 403 | 91,616 | 354,490 | 33,637,301 |
| Hispanic or Latino householder Map | 11 | 29,318 | 91,311 | 7,092,917 |
| HOUSING UNITS, OCCUPIED, TENURE BY HOUSEHOLD SIZE | ||||
| Owner occupied: Map | 2,004 | 229,920 | 925,286 | 75,986,074 |
| 1-person household Map | 432 | 50,970 | 195,555 | 16,453,569 |
| 2-person household Map | 707 | 81,735 | 325,808 | 27,618,605 |
| 3-person household Map | 337 | 39,414 | 160,024 | 12,517,563 |
| 4-person household Map | 331 | 36,269 | 150,836 | 10,998,793 |
| 5-person household Map | 154 | 14,779 | 62,773 | 5,057,765 |
| 6-person household Map | 30 | 4,586 | 20,237 | 1,965,796 |
| 7-or-more-person household Map | 13 | 2,167 | 10,053 | 1,373,983 |
| Renter occupied: Map | 414 | 120,934 | 445,801 | 40,730,218 |
| 1-person household Map | 226 | 49,554 | 178,093 | 14,751,340 |
| 2-person household Map | 94 | 31,626 | 117,287 | 10,624,023 |
| 3-person household Map | 45 | 18,108 | 66,634 | 6,240,422 |
| 4-person household Map | 33 | 12,141 | 46,280 | 4,626,453 |
| 5-person household Map | 9 | 5,692 | 22,143 | 2,480,866 |
| 6-person household Map | 5 | 2,297 | 9,111 | 1,108,903 |
| 7-or-more-person household Map | 2 | 1,516 | 6,253 | 898,211 |
Loading...