


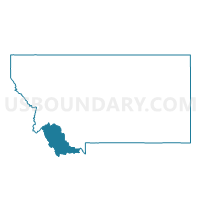
Census Tract 1, Beaverhead County, Montana
About
Outline

Summary
| Unique Area Identifier | 470605 |
| Name | Census Tract 1 |
| County | Beaverhead County |
| State | Montana |
| Area (square miles) | 4,211.96 |
| Land Area (square miles) | 4,182.97 |
| Water Area (square miles) | 28.99 |
| % of Land Area | 99.31 |
| % of Water Area | 0.69 |
| Latitude of the Internal Point | 45.10142350 |
| Longtitude of the Internal Point | -112.95799580 |
| Total Population | 1,366 |
| Total Housing Units | 1,335 |
| Total Households | 628 |
| Median Age | 49 |
Maps

Graphs
Select a template below for downloading or customizing gragh for Census Tract 1, Beaverhead County, Montana


Neighbors
Neighoring Census Tract (by Name) Neighboring Census Tract on the Map
- Census Tract 1, Madison County, MT
- Census Tract 2, Beaverhead County, MT
- Census Tract 3, Madison County, MT
- Census Tract 5, Deer Lodge County, MT
- Census Tract 8, Ravalli County, MT
- Census Tract 8, Silver Bow County, MT
- Census Tract 9501, Clark County, ID
- Census Tract 9701, Fremont County, ID
- Census Tract 9702, Lemhi County, ID
- Census Tract 9703, Lemhi County, ID
Top 10 Neighboring County Subdivision (by Population) Neighboring County Subdivision on the Map
- Dillon CCD, Beaverhead County, MT (7,880)
- Anaconda CCD, Deer Lodge County, MT (7,734)
- Salmon CCD, Lemhi County, ID (6,739)
- Madison Valley CCD, Madison County, MT (3,029)
- Island Park CCD, Fremont County, ID (1,492)
- Sula CCD, Ravalli County, MT (1,362)
- West Clark CCD, Clark County, ID (904)
- Leadore CCD, Lemhi County, ID (619)
- Big Hole Basin CCD, Beaverhead County, MT (615)
- Clark Canyon-Horse Prairie CCD, Beaverhead County, MT (376)
Top 10 Neighboring Place (by Population) Neighboring Place on the Map
- Butte-Silver Bow (balance), MT (33,525)
- Anaconda-Deer Lodge County, MT (9,298)
- Lima town, MT (221)
- Wisdom CDP, MT (98)
Top 10 Neighboring Elementary School District (by Population) Neighboring Elementary School District on the Map
- Dillon Elementary School District, MT (7,757)
- Alder Elementary School District, MT (292)
- Wise River Elementary School District, MT (291)
- Wisdom Elementary School District, MT (248)
- Divide Elementary School District, MT (180)
- Jackson Elementary School District, MT (152)
- Grant Elementary School District, MT (142)
- Polaris Elementary School District, MT (97)
Top 10 Neighboring Secondary School District (by Population) Neighboring Secondary School District on the Map
- Butte High School District, MT (34,152)
- Anaconda High School District, MT (9,099)
- Beaverhead County High School District, MT (8,738)
- Sheridan High School District, MT (1,673)
Top 10 Neighboring Unified School District (by Population) Neighboring Unified School District on the Map
- Fremont County Joint School District 215, ID (12,140)
- Salmon School District 291, ID (7,154)
- Darby K-12 Schools, MT (4,042)
- Ennis K-12 Schools, MT (3,482)
- Clark County School District 161, ID (982)
- South Lemhi School District 292, ID (625)
- Lima K-12 Schools, MT (508)
Top 10 Neighboring State Legislative District Lower Chamber (by Population) Neighboring State Legislative District Lower Chamber on the Map
- State House District 35, ID (43,409)
- State House District 71, MT (10,573)
- State House District 87, MT (9,798)
- State House District 72, MT (9,246)
- State House District 86, MT (8,842)
- State House District 73, MT (8,827)
Top 10 Neighboring State Legislative District Upper Chamber (by Population) Neighboring State Legislative District Upper Chamber on the Map
- State Senate District 35, ID (43,409)
- State Senate District 36, MT (19,819)
- State Senate District 44, MT (19,665)
- State Senate District 37, MT (17,497)
- State Senate District 43, MT (17,466)
Top 10 Neighboring 111th Congressional District (by Population) Neighboring 111th Congressional District on the Map
Top 10 Neighboring 5-Digit ZIP Code Tabulation Area (by Population) Neighboring 5-Digit ZIP Code Tabulation Area on the Map
- 59725, MT (7,963)
- 83467, ID (6,270)
- 83429, ID (1,048)
- 83462, ID (464)
- 83464, ID (345)
- 59739, MT (340)
- 59710, MT (286)
- 83466, ID (273)
- 59761, MT (265)
- 59762, MT (258)
Data
Demographic, Population, Households, and Housing Units
** Data sources from census 2010 **
Show Data on Map
Download Full List as CSV
Download Quick Sheet as CSV
| Subject | This Area | Beaverhead County | Montana | National |
|---|---|---|---|---|
| POPULATION | ||||
| Total Population Map | 1,366 | 9,246 | 989,415 | 308,745,538 |
| POPULATION, HISPANIC OR LATINO ORIGIN | ||||
| Not Hispanic or Latino Map | 1,309 | 8,908 | 960,850 | 258,267,944 |
| Hispanic or Latino Map | 57 | 338 | 28,565 | 50,477,594 |
| POPULATION, RACE | ||||
| White alone Map | 1,320 | 8,765 | 884,961 | 223,553,265 |
| Black or African American alone Map | 2 | 23 | 4,027 | 38,929,319 |
| American Indian and Alaska Native alone Map | 10 | 127 | 62,555 | 2,932,248 |
| Asian alone Map | 6 | 36 | 6,253 | 14,674,252 |
| Native Hawaiian and Other Pacific Islander alone Map | 6 | 38 | 668 | 540,013 |
| Some Other Race alone Map | 6 | 107 | 5,975 | 19,107,368 |
| Two or More Races Map | 16 | 150 | 24,976 | 9,009,073 |
| POPULATION, SEX | ||||
| Male Map | 734 | 4,731 | 496,667 | 151,781,326 |
| Female Map | 632 | 4,515 | 492,748 | 156,964,212 |
| POPULATION, AGE (18 YEARS) | ||||
| 18 years and over Map | 1,082 | 7,386 | 765,852 | 234,564,071 |
| Under 18 years | 284 | 1,860 | 223,563 | 74,181,467 |
| POPULATION, AGE | ||||
| Under 5 years | 61 | 493 | 62,423 | 20,201,362 |
| 5 to 9 years | 66 | 481 | 60,765 | 20,348,657 |
| 10 to 14 years | 98 | 478 | 61,124 | 20,677,194 |
| 15 to 17 years | 59 | 408 | 39,251 | 12,954,254 |
| 18 and 19 years | 13 | 381 | 27,473 | 9,086,089 |
| 20 years | 5 | 205 | 13,789 | 4,519,129 |
| 21 years | 9 | 172 | 13,517 | 4,354,294 |
| 22 to 24 years | 32 | 398 | 39,832 | 12,712,576 |
| 25 to 29 years | 42 | 525 | 64,123 | 21,101,849 |
| 30 to 34 years | 64 | 436 | 58,741 | 19,962,099 |
| 35 to 39 years | 80 | 469 | 55,575 | 20,179,642 |
| 40 to 44 years | 70 | 442 | 57,370 | 20,890,964 |
| 45 to 49 years | 108 | 622 | 71,021 | 22,708,591 |
| 50 to 54 years | 127 | 744 | 78,811 | 22,298,125 |
| 55 to 59 years | 132 | 777 | 75,915 | 19,664,805 |
| 60 and 61 years | 49 | 277 | 27,095 | 7,113,727 |
| 62 to 64 years | 83 | 373 | 35,848 | 9,704,197 |
| 65 and 66 years | 41 | 215 | 19,811 | 5,319,902 |
| 67 to 69 years | 78 | 314 | 26,745 | 7,115,361 |
| 70 to 74 years | 62 | 385 | 34,186 | 9,278,166 |
| 75 to 79 years | 40 | 302 | 25,637 | 7,317,795 |
| 80 to 84 years | 34 | 185 | 20,342 | 5,743,327 |
| 85 years and over | 13 | 164 | 20,021 | 5,493,433 |
| MEDIAN AGE BY SEX | ||||
| Both sexes Map | 49.00 | 42.00 | 39.80 | 37.20 |
| Male Map | 51.10 | 41.30 | 38.80 | 35.80 |
| Female Map | 46.60 | 42.90 | 41.00 | 38.50 |
| HOUSEHOLDS | ||||
| Total Households Map | 628 | 4,014 | 409,607 | 116,716,292 |
| HOUSEHOLDS, HOUSEHOLD TYPE | ||||
| Family households: Map | 387 | 2,383 | 257,087 | 77,538,296 |
| Husband-wife family Map | 350 | 2,002 | 201,611 | 56,510,377 |
| Other family: Map | 37 | 381 | 55,476 | 21,027,919 |
| Male householder, no wife present Map | 16 | 126 | 18,431 | 5,777,570 |
| Female householder, no husband present Map | 21 | 255 | 37,045 | 15,250,349 |
| Nonfamily households: Map | 241 | 1,631 | 152,520 | 39,177,996 |
| Householder living alone Map | 209 | 1,326 | 121,775 | 31,204,909 |
| Householder not living alone Map | 32 | 305 | 30,745 | 7,973,087 |
| HOUSEHOLDS, HISPANIC OR LATINO ORIGIN OF HOUSEHOLDER | ||||
| Not Hispanic or Latino householder: Map | 613 | 3,897 | 401,678 | 103,254,926 |
| Hispanic or Latino householder: Map | 15 | 117 | 7,929 | 13,461,366 |
| HOUSEHOLDS, RACE OF HOUSEHOLDER | ||||
| Householder who is White alone | 618 | 3,854 | 379,280 | 89,754,352 |
| Householder who is Black or African American alone | 0 | 7 | 1,245 | 14,129,983 |
| Householder who is American Indian and Alaska Native alone | 3 | 46 | 18,263 | 939,707 |
| Householder who is Asian alone | 1 | 11 | 1,909 | 4,632,164 |
| Householder who is Native Hawaiian and Other Pacific Islander alone | 1 | 11 | 231 | 143,932 |
| Householder who is Some Other Race alone | 3 | 45 | 1,889 | 4,916,427 |
| Householder who is Two or More Races | 2 | 40 | 6,790 | 2,199,727 |
| HOUSEHOLDS, HOUSEHOLD TYPE BY HOUSEHOLD SIZE | ||||
| Family households: Map | 387 | 2,383 | 257,087 | 77,538,296 |
| 2-person household Map | 236 | 1,358 | 129,321 | 31,882,616 |
| 3-person household Map | 60 | 414 | 52,940 | 17,765,829 |
| 4-person household Map | 49 | 371 | 43,033 | 15,214,075 |
| 5-person household Map | 27 | 162 | 20,021 | 7,411,997 |
| 6-person household Map | 8 | 50 | 7,461 | 3,026,278 |
| 7-or-more-person household Map | 7 | 28 | 4,311 | 2,237,501 |
| Nonfamily households: Map | 241 | 1,631 | 152,520 | 39,177,996 |
| 1-person household Map | 209 | 1,326 | 121,775 | 31,204,909 |
| 2-person household Map | 24 | 230 | 24,654 | 6,360,012 |
| 3-person household Map | 5 | 54 | 4,106 | 992,156 |
| 4-person household Map | 3 | 12 | 1,374 | 411,171 |
| 5-person household Map | 0 | 9 | 445 | 126,634 |
| 6-person household Map | 0 | 0 | 102 | 48,421 |
| 7-or-more-person household Map | 0 | 0 | 64 | 34,693 |
| HOUSING UNITS | ||||
| Total Housing Units Map | 1,335 | 5,273 | 482,825 | 131,704,730 |
| HOUSING UNITS, OCCUPANCY STATUS | ||||
| Occupied Map | 628 | 4,014 | 409,607 | 116,716,292 |
| Vacant Map | 707 | 1,259 | 73,218 | 14,988,438 |
| HOUSING UNITS, OCCUPIED, TENURE | ||||
| Owned with a mortgage or a loan Map | 176 | 1,438 | 171,236 | 52,979,430 |
| Owned free and clear Map | 221 | 1,151 | 107,182 | 23,006,644 |
| Renter occupied Map | 231 | 1,425 | 131,189 | 40,730,218 |
| HOUSING UNITS, VACANT, VACANCY STATUS | ||||
| For rent Map | 19 | 97 | 10,082 | 4,137,567 |
| Rented, not occupied Map | 3 | 6 | 773 | 206,825 |
| For sale only Map | 18 | 50 | 5,964 | 1,896,796 |
| Sold, not occupied Map | 5 | 15 | 1,353 | 421,032 |
| For seasonal, recreational, or occasional use Map | 537 | 835 | 38,510 | 4,649,298 |
| For migrant workers Map | 50 | 62 | 283 | 24,161 |
| Other vacant Map | 75 | 194 | 16,253 | 3,652,759 |
| HOUSING UNITS, OCCUPIED, AVERAGE HOUSEHOLD SIZE BY TENURE | ||||
| Total: Map | 2.18 | 2.19 | 2.35 | 2.58 |
| Owner occupied Map | 2.14 | 2.26 | 2.42 | 2.65 |
| Renter occupied Map | 2.24 | 2.08 | 2.18 | 2.44 |
| HOUSING UNITS, OCCUPIED, TENURE BY RACE OF HOUSEHOLDER | ||||
| Owner occupied: Map | 397 | 2,589 | 278,418 | 75,986,074 |
| Householder who is White alone Map | 392 | 2,518 | 263,920 | 63,446,275 |
| Householder who is Black or African American alone Map | 0 | 1 | 380 | 6,261,464 |
| Householder who is American Indian and Alaska Native alone Map | 3 | 27 | 8,800 | 509,588 |
| Householder who is Asian alone Map | 0 | 5 | 946 | 2,688,861 |
| Householder who is Native Hawaiian and Other Pacific Islander alone Map | 1 | 3 | 107 | 61,911 |
| Householder who is Some Other Race alone Map | 1 | 10 | 819 | 1,975,817 |
| Householder who is Two or More Races Map | 0 | 25 | 3,446 | 1,042,158 |
| Renter occupied: Map | 231 | 1,425 | 131,189 | 40,730,218 |
| Householder who is White alone Map | 226 | 1,336 | 115,360 | 26,308,077 |
| Householder who is Black or African American alone Map | 0 | 6 | 865 | 7,868,519 |
| Householder who is American Indian and Alaska Native alone Map | 0 | 19 | 9,463 | 430,119 |
| Householder who is Asian alone Map | 1 | 6 | 963 | 1,943,303 |
| Householder who is Native Hawaiian and Other Pacific Islander alone Map | 0 | 8 | 124 | 82,021 |
| Householder who is Some Other Race alone Map | 2 | 35 | 1,070 | 2,940,610 |
| Householder who is Two or More Races Map | 2 | 15 | 3,344 | 1,157,569 |
| HOUSING UNITS, OCCUPIED, TENURE BY HISPANIC OR LATINO ORIGIN OF HOUSEHOLDER | ||||
| Owner occupied: Map | 397 | 2,589 | 278,418 | 75,986,074 |
| Not Hispanic or Latino householder Map | 394 | 2,551 | 274,612 | 69,617,625 |
| Hispanic or Latino householder Map | 3 | 38 | 3,806 | 6,368,449 |
| Renter occupied: Map | 231 | 1,425 | 131,189 | 40,730,218 |
| Not Hispanic or Latino householder Map | 219 | 1,346 | 127,066 | 33,637,301 |
| Hispanic or Latino householder Map | 12 | 79 | 4,123 | 7,092,917 |
| HOUSING UNITS, OCCUPIED, TENURE BY HOUSEHOLD SIZE | ||||
| Owner occupied: Map | 397 | 2,589 | 278,418 | 75,986,074 |
| 1-person household Map | 123 | 702 | 66,631 | 16,453,569 |
| 2-person household Map | 189 | 1,184 | 118,084 | 27,618,605 |
| 3-person household Map | 36 | 291 | 38,883 | 12,517,563 |
| 4-person household Map | 21 | 246 | 32,324 | 10,998,793 |
| 5-person household Map | 20 | 114 | 14,473 | 5,057,765 |
| 6-person household Map | 2 | 28 | 5,172 | 1,965,796 |
| 7-or-more-person household Map | 6 | 24 | 2,851 | 1,373,983 |
| Renter occupied: Map | 231 | 1,425 | 131,189 | 40,730,218 |
| 1-person household Map | 86 | 624 | 55,144 | 14,751,340 |
| 2-person household Map | 71 | 404 | 35,891 | 10,624,023 |
| 3-person household Map | 29 | 177 | 18,163 | 6,240,422 |
| 4-person household Map | 31 | 137 | 12,083 | 4,626,453 |
| 5-person household Map | 7 | 57 | 5,993 | 2,480,866 |
| 6-person household Map | 6 | 22 | 2,391 | 1,108,903 |
| 7-or-more-person household Map | 1 | 4 | 1,524 | 898,211 |
Loading...