


West Contra Costa CCD, Contra Costa County, California
About
Outline

Summary
| Unique Area Identifier | 124418 |
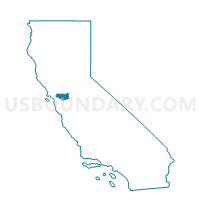
| Name | West Contra Costa CCD |
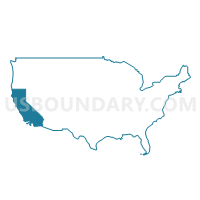
| County | Contra Costa County |
| State | California |
| Area (square miles) | 114.99 |
| Land Area (square miles) | 68.26 |
| Water Area (square miles) | 46.73 |
| % of Land Area | 59.36 |
| % of Water Area | 40.64 |
| Latitude of the Internal Point | 37.98421140 |
| Longtitude of the Internal Point | -122.32176570 |
| Total Population | 245,523 |
| Total Housing Units | 93,387 |
| Total Households | 86,595 |
| Median Age | 37.1 |
Maps

Graphs
Select a template below for downloading or customizing gragh for West Contra Costa CCD, Contra Costa County, California


Neighbors
Neighoring County Subdivision (by Name) Neighboring County Subdivision on the Map
- Berkeley CCD, Alameda County, CA
- Briones CCD, Contra Costa County, CA
- Central Contra Costa CCD, Contra Costa County, CA
- Novato CCD, Marin County, CA
- Ross Valley CCD, Marin County, CA
- San Francisco CCD, San Francisco County, CA
- San Rafael CCD, Marin County, CA
- Sonoma CCD, Sonoma County, CA
- Vallejo CCD, Solano County, CA
Top 10 Neighboring Place (by Population) Neighboring Place on the Map
- San Francisco city, CA (805,235)
- Vallejo city, CA (115,942)
- Berkeley city, CA (112,580)
- Richmond city, CA (103,701)
- San Rafael city, CA (57,713)
- San Pablo city, CA (29,139)
- Benicia city, CA (26,997)
- Hercules city, CA (24,060)
- El Cerrito city, CA (23,549)
- Albany city, CA (18,539)
Top 10 Neighboring Elementary School District (by Population) Neighboring Elementary School District on the Map
- San Rafael City Elementary School District, CA (54,884)
- Old Adobe Union Elementary School District, CA (25,770)
- Dixie Elementary School District, CA (21,296)
- Orinda Union Elementary School District, CA (17,693)
- Larkspur Elementary School District, CA (13,693)
Top 10 Neighboring Secondary School District (by Population) Neighboring Secondary School District on the Map
- Tamalpais Union High School District, CA (113,295)
- Acalanes Union High School District, CA (108,128)
- San Rafael City High School District, CA (76,180)
- Petaluma Joint Union High School District, CA (73,384)
Top 10 Neighboring Unified School District (by Population) Neighboring Unified School District on the Map
- San Francisco Unified School District, CA (805,235)
- West Contra Costa Unified School District, CA (235,847)
- Vallejo City Unified School District, CA (119,022)
- Berkeley Unified School District, CA (112,517)
- Novato Unified School District, CA (58,596)
- Martinez Unified School District, CA (28,945)
- Benicia Unified School District, CA (27,136)
- Albany City Unified School District, CA (18,549)
- John Swett Unified School District, CA (13,888)
Top 10 Neighboring State Legislative District Lower Chamber (by Population) Neighboring State Legislative District Lower Chamber on the Map
- Assembly District 8, CA (472,487)
- Assembly District 7, CA (453,345)
- Assembly District 14, CA (445,394)
- Assembly District 11, CA (445,356)
- Assembly District 13, CA (444,835)
- Assembly District 6, CA (433,034)
Top 10 Neighboring State Legislative District Upper Chamber (by Population) Neighboring State Legislative District Upper Chamber on the Map
- State Senate District 7, CA (947,426)
- State Senate District 2, CA (897,433)
- State Senate District 3, CA (880,421)
- State Senate District 9, CA (878,605)
Top 10 Neighboring 111th Congressional District (by Population) Neighboring 111th Congressional District on the Map
- Congressional District 10, CA (714,750)
- Congressional District 8, CA (666,827)
- Congressional District 6, CA (664,468)
- Congressional District 7, CA (655,708)
- Congressional District 9, CA (648,766)
Top 10 Neighboring Census Tract (by Population) Neighboring Census Tract on the Map
- Census Tract 3922, Contra Costa County, CA (10,605)
- Census Tract 3720, Contra Costa County, CA (7,353)
- Census Tract 3630, Contra Costa County, CA (7,043)
- Census Tract 3820, Contra Costa County, CA (6,964)
- Census Tract 3770, Contra Costa County, CA (6,962)
- Census Tract 3592.03, Contra Costa County, CA (6,726)
- Census Tract 3690.01, Contra Costa County, CA (6,246)
- Census Tract 3592.02, Contra Costa County, CA (6,148)
- Census Tract 3790, Contra Costa County, CA (6,117)
- Census Tract 3810, Contra Costa County, CA (6,097)
Top 10 Neighboring 5-Digit ZIP Code Tabulation Area (by Population) Neighboring 5-Digit ZIP Code Tabulation Area on the Map
- 94806, CA (59,861)
- 94591, CA (53,042)
- 94553, CA (47,065)
- 94804, CA (38,559)
- 94590, CA (35,420)
- 94801, CA (29,395)
- 94510, CA (27,088)
- 94803, CA (24,904)
- 94547, CA (24,092)
- 94530, CA (23,877)
Data
Demographic, Population, Households, and Housing Units
** Data sources from census 2010 **
Show Data on Map
Download Full List as CSV
Download Quick Sheet as CSV
| Subject | This Area | Contra Costa County | California | National |
|---|---|---|---|---|
| POPULATION | ||||
| Total Population Map | 245,523 | 1,049,025 | 37,253,956 | 308,745,538 |
| POPULATION, HISPANIC OR LATINO ORIGIN | ||||
| Not Hispanic or Latino Map | 163,977 | 793,465 | 23,240,237 | 258,267,944 |
| Hispanic or Latino Map | 81,546 | 255,560 | 14,013,719 | 50,477,594 |
| POPULATION, RACE | ||||
| White alone Map | 92,937 | 614,512 | 21,453,934 | 223,553,265 |
| Black or African American alone Map | 46,724 | 97,161 | 2,299,072 | 38,929,319 |
| American Indian and Alaska Native alone Map | 1,641 | 6,122 | 362,801 | 2,932,248 |
| Asian alone Map | 45,852 | 151,469 | 4,861,007 | 14,674,252 |
| Native Hawaiian and Other Pacific Islander alone Map | 1,204 | 4,845 | 144,386 | 540,013 |
| Some Other Race alone Map | 42,393 | 112,691 | 6,317,372 | 19,107,368 |
| Two or More Races Map | 14,772 | 62,225 | 1,815,384 | 9,009,073 |
| POPULATION, SEX | ||||
| Male Map | 119,181 | 511,526 | 18,517,830 | 151,781,326 |
| Female Map | 126,342 | 537,499 | 18,736,126 | 156,964,212 |
| POPULATION, AGE (18 YEARS) | ||||
| 18 years and over Map | 187,599 | 788,520 | 27,958,916 | 234,564,071 |
| Under 18 years | 57,924 | 260,505 | 9,295,040 | 74,181,467 |
| POPULATION, AGE | ||||
| Under 5 years | 16,562 | 67,018 | 2,531,333 | 20,201,362 |
| 5 to 9 years | 15,918 | 72,285 | 2,505,839 | 20,348,657 |
| 10 to 14 years | 15,558 | 74,444 | 2,590,930 | 20,677,194 |
| 15 to 17 years | 9,886 | 46,758 | 1,666,938 | 12,954,254 |
| 18 and 19 years | 6,611 | 27,008 | 1,157,002 | 9,086,089 |
| 20 years | 3,320 | 12,513 | 573,642 | 4,519,129 |
| 21 years | 3,118 | 11,473 | 555,775 | 4,354,294 |
| 22 to 24 years | 9,658 | 35,957 | 1,636,532 | 12,712,576 |
| 25 to 29 years | 17,626 | 64,747 | 2,744,409 | 21,101,849 |
| 30 to 34 years | 17,237 | 64,896 | 2,573,468 | 19,962,099 |
| 35 to 39 years | 17,178 | 70,520 | 2,573,579 | 20,179,642 |
| 40 to 44 years | 17,477 | 78,130 | 2,609,131 | 20,890,964 |
| 45 to 49 years | 18,083 | 84,006 | 2,689,819 | 22,708,591 |
| 50 to 54 years | 17,698 | 80,074 | 2,562,552 | 22,298,125 |
| 55 to 59 years | 16,191 | 69,400 | 2,204,296 | 19,664,805 |
| 60 and 61 years | 6,138 | 25,145 | 786,276 | 7,113,727 |
| 62 to 64 years | 8,171 | 34,213 | 1,045,921 | 9,704,197 |
| 65 and 66 years | 4,100 | 18,216 | 568,817 | 5,319,902 |
| 67 to 69 years | 5,302 | 23,060 | 734,741 | 7,115,361 |
| 70 to 74 years | 6,730 | 29,443 | 971,778 | 9,278,166 |
| 75 to 79 years | 5,034 | 22,383 | 766,971 | 7,317,795 |
| 80 to 84 years | 3,799 | 17,964 | 603,239 | 5,743,327 |
| 85 years and over | 4,128 | 19,372 | 600,968 | 5,493,433 |
| MEDIAN AGE BY SEX | ||||
| Both sexes Map | 37.10 | 38.50 | 35.20 | 37.20 |
| Male Map | 35.70 | 37.10 | 34.00 | 35.80 |
| Female Map | 38.50 | 39.70 | 36.30 | 38.50 |
| HOUSEHOLDS | ||||
| Total Households Map | 86,595 | 375,364 | 12,577,498 | 116,716,292 |
| HOUSEHOLDS, HOUSEHOLD TYPE | ||||
| Family households: Map | 59,150 | 265,280 | 8,642,473 | 77,538,296 |
| Husband-wife family Map | 39,171 | 199,021 | 6,213,310 | 56,510,377 |
| Other family: Map | 19,979 | 66,259 | 2,429,163 | 21,027,919 |
| Male householder, no wife present Map | 5,527 | 19,553 | 752,347 | 5,777,570 |
| Female householder, no husband present Map | 14,452 | 46,706 | 1,676,816 | 15,250,349 |
| Nonfamily households: Map | 27,445 | 110,084 | 3,935,025 | 39,177,996 |
| Householder living alone Map | 21,337 | 85,055 | 2,929,442 | 31,204,909 |
| Householder not living alone Map | 6,108 | 25,029 | 1,005,583 | 7,973,087 |
| HOUSEHOLDS, HISPANIC OR LATINO ORIGIN OF HOUSEHOLDER | ||||
| Not Hispanic or Latino householder: Map | 66,612 | 311,317 | 9,192,322 | 103,254,926 |
| Hispanic or Latino householder: Map | 19,983 | 64,047 | 3,385,176 | 13,461,366 |
| HOUSEHOLDS, RACE OF HOUSEHOLDER | ||||
| Householder who is White alone | 38,173 | 246,116 | 8,129,331 | 89,754,352 |
| Householder who is Black or African American alone | 18,980 | 36,331 | 835,651 | 14,129,983 |
| Householder who is American Indian and Alaska Native alone | 538 | 2,082 | 113,235 | 939,707 |
| Householder who is Asian alone | 14,714 | 48,055 | 1,529,789 | 4,632,164 |
| Householder who is Native Hawaiian and Other Pacific Islander alone | 327 | 1,303 | 38,238 | 143,932 |
| Householder who is Some Other Race alone | 10,181 | 27,742 | 1,497,993 | 4,916,427 |
| Householder who is Two or More Races | 3,682 | 13,735 | 433,261 | 2,199,727 |
| HOUSEHOLDS, HOUSEHOLD TYPE BY HOUSEHOLD SIZE | ||||
| Family households: Map | 59,150 | 265,280 | 8,642,473 | 77,538,296 |
| 2-person household Map | 20,545 | 96,457 | 2,887,696 | 31,882,616 |
| 3-person household Map | 14,008 | 61,142 | 1,904,697 | 17,765,829 |
| 4-person household Map | 11,740 | 58,844 | 1,823,355 | 15,214,075 |
| 5-person household Map | 6,486 | 27,886 | 1,018,257 | 7,411,997 |
| 6-person household Map | 3,144 | 11,625 | 497,773 | 3,026,278 |
| 7-or-more-person household Map | 3,227 | 9,326 | 510,695 | 2,237,501 |
| Nonfamily households: Map | 27,445 | 110,084 | 3,935,025 | 39,177,996 |
| 1-person household Map | 21,337 | 85,055 | 2,929,442 | 31,204,909 |
| 2-person household Map | 4,891 | 20,066 | 766,106 | 6,360,012 |
| 3-person household Map | 727 | 3,042 | 139,115 | 992,156 |
| 4-person household Map | 280 | 1,131 | 60,096 | 411,171 |
| 5-person household Map | 125 | 443 | 22,151 | 126,634 |
| 6-person household Map | 56 | 216 | 9,698 | 48,421 |
| 7-or-more-person household Map | 29 | 131 | 8,417 | 34,693 |
| HOUSING UNITS | ||||
| Total Housing Units Map | 93,387 | 400,263 | 13,680,081 | 131,704,730 |
| HOUSING UNITS, OCCUPANCY STATUS | ||||
| Occupied Map | 86,595 | 375,364 | 12,577,498 | 116,716,292 |
| Vacant Map | 6,792 | 24,899 | 1,102,583 | 14,988,438 |
| HOUSING UNITS, OCCUPIED, TENURE | ||||
| Owned with a mortgage or a loan Map | 39,831 | 202,821 | 5,465,345 | 52,979,430 |
| Owned free and clear Map | 11,381 | 49,083 | 1,570,026 | 23,006,644 |
| Renter occupied Map | 35,383 | 123,460 | 5,542,127 | 40,730,218 |
| HOUSING UNITS, VACANT, VACANCY STATUS | ||||
| For rent Map | 2,937 | 9,047 | 374,610 | 4,137,567 |
| Rented, not occupied Map | 109 | 507 | 20,347 | 206,825 |
| For sale only Map | 1,149 | 5,309 | 154,775 | 1,896,796 |
| Sold, not occupied Map | 272 | 1,128 | 34,288 | 421,032 |
| For seasonal, recreational, or occasional use Map | 322 | 2,400 | 302,815 | 4,649,298 |
| For migrant workers Map | 1 | 16 | 2,100 | 24,161 |
| Other vacant Map | 2,002 | 6,492 | 213,648 | 3,652,759 |
| HOUSING UNITS, OCCUPIED, AVERAGE HOUSEHOLD SIZE BY TENURE | ||||
| Total: Map | 2.81 | 2.77 | 2.90 | 2.58 |
| Owner occupied Map | 2.81 | 2.78 | 2.95 | 2.65 |
| Renter occupied Map | 2.81 | 2.74 | 2.83 | 2.44 |
| HOUSING UNITS, OCCUPIED, TENURE BY RACE OF HOUSEHOLDER | ||||
| Owner occupied: Map | 51,212 | 251,904 | 7,035,371 | 75,986,074 |
| Householder who is White alone Map | 25,883 | 179,223 | 4,996,053 | 63,446,275 |
| Householder who is Black or African American alone Map | 7,990 | 15,744 | 310,834 | 6,261,464 |
| Householder who is American Indian and Alaska Native alone Map | 278 | 1,179 | 52,963 | 509,588 |
| Householder who is Asian alone Map | 10,485 | 35,063 | 878,924 | 2,688,861 |
| Householder who is Native Hawaiian and Other Pacific Islander alone Map | 150 | 610 | 16,570 | 61,911 |
| Householder who is Some Other Race alone Map | 4,536 | 12,658 | 589,196 | 1,975,817 |
| Householder who is Two or More Races Map | 1,890 | 7,427 | 190,831 | 1,042,158 |
| Renter occupied: Map | 35,383 | 123,460 | 5,542,127 | 40,730,218 |
| Householder who is White alone Map | 12,290 | 66,893 | 3,133,278 | 26,308,077 |
| Householder who is Black or African American alone Map | 10,990 | 20,587 | 524,817 | 7,868,519 |
| Householder who is American Indian and Alaska Native alone Map | 260 | 903 | 60,272 | 430,119 |
| Householder who is Asian alone Map | 4,229 | 12,992 | 650,865 | 1,943,303 |
| Householder who is Native Hawaiian and Other Pacific Islander alone Map | 177 | 693 | 21,668 | 82,021 |
| Householder who is Some Other Race alone Map | 5,645 | 15,084 | 908,797 | 2,940,610 |
| Householder who is Two or More Races Map | 1,792 | 6,308 | 242,430 | 1,157,569 |
| HOUSING UNITS, OCCUPIED, TENURE BY HISPANIC OR LATINO ORIGIN OF HOUSEHOLDER | ||||
| Owner occupied: Map | 51,212 | 251,904 | 7,035,371 | 75,986,074 |
| Not Hispanic or Latino householder Map | 41,273 | 218,410 | 5,529,138 | 69,617,625 |
| Hispanic or Latino householder Map | 9,939 | 33,494 | 1,506,233 | 6,368,449 |
| Renter occupied: Map | 35,383 | 123,460 | 5,542,127 | 40,730,218 |
| Not Hispanic or Latino householder Map | 25,339 | 92,907 | 3,663,184 | 33,637,301 |
| Hispanic or Latino householder Map | 10,044 | 30,553 | 1,878,943 | 7,092,917 |
| HOUSING UNITS, OCCUPIED, TENURE BY HOUSEHOLD SIZE | ||||
| Owner occupied: Map | 51,212 | 251,904 | 7,035,371 | 75,986,074 |
| 1-person household Map | 11,398 | 49,321 | 1,340,915 | 16,453,569 |
| 2-person household Map | 16,598 | 85,270 | 2,269,063 | 27,618,605 |
| 3-person household Map | 8,604 | 43,148 | 1,164,562 | 12,517,563 |
| 4-person household Map | 7,286 | 42,939 | 1,129,739 | 10,998,793 |
| 5-person household Map | 3,686 | 18,516 | 577,673 | 5,057,765 |
| 6-person household Map | 1,788 | 7,326 | 273,058 | 1,965,796 |
| 7-or-more-person household Map | 1,852 | 5,384 | 280,361 | 1,373,983 |
| Renter occupied: Map | 35,383 | 123,460 | 5,542,127 | 40,730,218 |
| 1-person household Map | 9,939 | 35,734 | 1,588,527 | 14,751,340 |
| 2-person household Map | 8,838 | 31,253 | 1,384,739 | 10,624,023 |
| 3-person household Map | 6,131 | 21,036 | 879,250 | 6,240,422 |
| 4-person household Map | 4,734 | 17,036 | 753,712 | 4,626,453 |
| 5-person household Map | 2,925 | 9,813 | 462,735 | 2,480,866 |
| 6-person household Map | 1,412 | 4,515 | 234,413 | 1,108,903 |
| 7-or-more-person household Map | 1,404 | 4,073 | 238,751 | 898,211 |
Loading...