


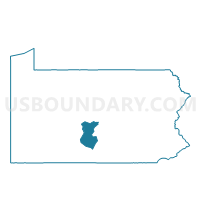
Huntingdon County, Pennsylvania
About
Outline

Summary
| Unique Area Identifier | 119252 |
| Name | Huntingdon County |
| State | Pennsylvania |
| Area (square miles) | 889.27 |
| Land Area (square miles) | 874.64 |
| Water Area (square miles) | 14.63 |
| % of Land Area | 98.36 |
| % of Water Area | 1.64 |
| Latitude of the Internal Point | 40.42232120 |
| Longtitude of the Internal Point | -77.96858360 |
| Total Population | 45,913 |
| Total Housing Units | 22,365 |
| Total Households | 17,280 |
| Median Age | 41.2 |
Maps
Graphs
Select a template below for downloading or customizing gragh for Huntingdon County, Pennsylvania


Neighbors
Neighoring County (by Name) Neighboring County on the Map
- Bedford County, PA
- Blair County, PA
- Centre County, PA
- Franklin County, PA
- Fulton County, PA
- Juniata County, PA
- Mifflin County, PA
County Subdivision in Huntingdon County (by Name) Neighboring County Subdivision on the Map
- Alexandria borough, Huntingdon County, PA
- Barree township, Huntingdon County, PA
- Birmingham borough, Huntingdon County, PA
- Brady township, Huntingdon County, PA
- Broad Top City borough, Huntingdon County, PA
- Carbon township, Huntingdon County, PA
- Cass township, Huntingdon County, PA
- Cassville borough, Huntingdon County, PA
- Clay township, Huntingdon County, PA
- Coalmont borough, Huntingdon County, PA
- Cromwell township, Huntingdon County, PA
- Dublin township, Huntingdon County, PA
- Dudley borough, Huntingdon County, PA
- Franklin township, Huntingdon County, PA
- Henderson township, Huntingdon County, PA
- Hopewell township, Huntingdon County, PA
- Huntingdon borough, Huntingdon County, PA
- Jackson township, Huntingdon County, PA
- Juniata township, Huntingdon County, PA
- Lincoln township, Huntingdon County, PA
- Logan township, Huntingdon County, PA
- Mapleton borough, Huntingdon County, PA
- Marklesburg borough, Huntingdon County, PA
- Mill Creek borough, Huntingdon County, PA
- Miller township, Huntingdon County, PA
- Morris township, Huntingdon County, PA
- Mount Union borough, Huntingdon County, PA
- Oneida township, Huntingdon County, PA
- Orbisonia borough, Huntingdon County, PA
- Penn township, Huntingdon County, PA
- Petersburg borough, Huntingdon County, PA
- Porter township, Huntingdon County, PA
- Rockhill borough, Huntingdon County, PA
- Saltillo borough, Huntingdon County, PA
- Shade Gap borough, Huntingdon County, PA
- Shirley township, Huntingdon County, PA
- Shirleysburg borough, Huntingdon County, PA
- Smithfield township, Huntingdon County, PA
- Springfield township, Huntingdon County, PA
- Spruce Creek township, Huntingdon County, PA
- Tell township, Huntingdon County, PA
- Three Springs borough, Huntingdon County, PA
- Todd township, Huntingdon County, PA
- Union township, Huntingdon County, PA
- Walker township, Huntingdon County, PA
- Warriors Mark township, Huntingdon County, PA
- West township, Huntingdon County, PA
- Wood township, Huntingdon County, PA
Top 10 Neighboring Place (by Population) Neighboring Place on the Map
- Huntingdon borough, PA (7,093)
- Mount Union borough, PA (2,447)
- McConnellstown CDP, PA (1,194)
- Allenport CDP, PA (648)
- Petersburg borough, PA (480)
- Broad Top City borough, PA (452)
- Three Springs borough, PA (444)
- Mapleton borough, PA (441)
- Orbisonia borough, PA (428)
- Rockhill borough, PA (371)
Top 10 Neighboring Unified School District (by Population) Neighboring Unified School District on the Map
- State College Area School District, PA (92,270)
- Mifflin County School District, PA (43,607)
- Juniata County School District, PA (24,019)
- Huntingdon Area School District, PA (20,447)
- Spring Cove School District, PA (14,446)
- Tyrone Area School District, PA (12,928)
- Penns Valley Area School District, PA (12,819)
- Mount Union Area School District, PA (9,666)
- Southern Huntingdon County School District, PA (7,984)
- Tussey Mountain School District, PA (7,329)
Top 10 Neighboring State Legislative District Lower Chamber (by Population) Neighboring State Legislative District Lower Chamber on the Map
- State House District 77, PA (70,466)
- State House District 171, PA (67,294)
- State House District 86, PA (66,211)
- State House District 82, PA (64,036)
- State House District 80, PA (62,593)
- State House District 78, PA (60,809)
- State House District 81, PA (60,600)
Top 10 Neighboring State Legislative District Upper Chamber (by Population) Neighboring State Legislative District Upper Chamber on the Map
- State Senate District 33, PA (280,954)
- State Senate District 34, PA (268,795)
- State Senate District 30, PA (239,492)
Top 10 Neighboring 111th Congressional District (by Population) Neighboring 111th Congressional District on the Map
Top 10 Census Tract in Huntingdon County (by Population) Neighboring Census Tract on the Map
- Census Tract 9503, Huntingdon County, PA (7,862)
- Census Tract 9504, Huntingdon County, PA (7,093)
- Census Tract 9512, Huntingdon County, PA (4,679)
- Census Tract 9506, Huntingdon County, PA (4,120)
- Census Tract 9508, Huntingdon County, PA (3,684)
- Census Tract 9502, Huntingdon County, PA (3,573)
- Census Tract 9505, Huntingdon County, PA (3,510)
- Census Tract 9510, Huntingdon County, PA (2,674)
- Census Tract 9509, Huntingdon County, PA (2,447)
- Census Tract 9513, Huntingdon County, PA (2,411)
Top 10 Neighboring 5-Digit ZIP Code Tabulation Area (by Population) Neighboring 5-Digit ZIP Code Tabulation Area on the Map
- 16801, PA (42,812)
- 16652, PA (18,028)
- 16686, PA (13,488)
- 16870, PA (7,046)
- 16662, PA (6,040)
- 17066, PA (5,348)
- 17004, PA (5,000)
- 17051, PA (4,653)
- 17084, PA (4,340)
- 16693, PA (4,185)
Data
Demographic, Population, Households, and Housing Units
** Data sources from census 2010 **
Show Data on Map
Download Full List as CSV
Download Quick Sheet as CSV
| Subject | This Area | Pennsylvania | National |
|---|---|---|---|
| POPULATION | |||
| Total Population Map | 45,913 | 12,702,379 | 308,745,538 |
| POPULATION, HISPANIC OR LATINO ORIGIN | |||
| Not Hispanic or Latino Map | 45,186 | 11,982,719 | 258,267,944 |
| Hispanic or Latino Map | 727 | 719,660 | 50,477,594 |
| POPULATION, RACE | |||
| White alone Map | 42,470 | 10,406,288 | 223,553,265 |
| Black or African American alone Map | 2,392 | 1,377,689 | 38,929,319 |
| American Indian and Alaska Native alone Map | 41 | 26,843 | 2,932,248 |
| Asian alone Map | 184 | 349,088 | 14,674,252 |
| Native Hawaiian and Other Pacific Islander alone Map | 2 | 3,653 | 540,013 |
| Some Other Race alone Map | 400 | 300,983 | 19,107,368 |
| Two or More Races Map | 424 | 237,835 | 9,009,073 |
| POPULATION, SEX | |||
| Male Map | 24,278 | 6,190,363 | 151,781,326 |
| Female Map | 21,635 | 6,512,016 | 156,964,212 |
| POPULATION, AGE (18 YEARS) | |||
| 18 years and over Map | 36,669 | 9,910,224 | 234,564,071 |
| Under 18 years | 9,244 | 2,792,155 | 74,181,467 |
| POPULATION, AGE | |||
| Under 5 years | 2,497 | 729,538 | 20,201,362 |
| 5 to 9 years | 2,449 | 753,635 | 20,348,657 |
| 10 to 14 years | 2,656 | 791,151 | 20,677,194 |
| 15 to 17 years | 1,642 | 517,831 | 12,954,254 |
| 18 and 19 years | 1,415 | 387,235 | 9,086,089 |
| 20 years | 772 | 191,942 | 4,519,129 |
| 21 years | 605 | 183,257 | 4,354,294 |
| 22 to 24 years | 1,663 | 498,947 | 12,712,576 |
| 25 to 29 years | 2,628 | 781,527 | 21,101,849 |
| 30 to 34 years | 2,846 | 729,592 | 19,962,099 |
| 35 to 39 years | 2,993 | 764,287 | 20,179,642 |
| 40 to 44 years | 3,163 | 851,382 | 20,890,964 |
| 45 to 49 years | 3,486 | 955,763 | 22,708,591 |
| 50 to 54 years | 3,433 | 984,641 | 22,298,125 |
| 55 to 59 years | 3,200 | 879,048 | 19,664,805 |
| 60 and 61 years | 1,259 | 312,575 | 7,113,727 |
| 62 to 64 years | 1,748 | 430,721 | 9,704,197 |
| 65 and 66 years | 1,007 | 231,623 | 5,319,902 |
| 67 to 69 years | 1,330 | 321,379 | 7,115,361 |
| 70 to 74 years | 1,769 | 426,536 | 9,278,166 |
| 75 to 79 years | 1,413 | 362,332 | 7,317,795 |
| 80 to 84 years | 1,100 | 311,761 | 5,743,327 |
| 85 years and over | 839 | 305,676 | 5,493,433 |
| MEDIAN AGE BY SEX | |||
| Both sexes Map | 41.20 | 40.10 | 37.20 |
| Male Map | 39.90 | 38.70 | 35.80 |
| Female Map | 43.00 | 41.50 | 38.50 |
| HOUSEHOLDS | |||
| Total Households Map | 17,280 | 5,018,904 | 116,716,292 |
| HOUSEHOLDS, HOUSEHOLD TYPE | |||
| Family households: Map | 11,684 | 3,261,307 | 77,538,296 |
| Husband-wife family Map | 9,347 | 2,417,765 | 56,510,377 |
| Other family: Map | 2,337 | 843,542 | 21,027,919 |
| Male householder, no wife present Map | 838 | 229,495 | 5,777,570 |
| Female householder, no husband present Map | 1,499 | 614,047 | 15,250,349 |
| Nonfamily households: Map | 5,596 | 1,757,597 | 39,177,996 |
| Householder living alone Map | 4,769 | 1,433,415 | 31,204,909 |
| Householder not living alone Map | 827 | 324,182 | 7,973,087 |
| HOUSEHOLDS, HISPANIC OR LATINO ORIGIN OF HOUSEHOLDER | |||
| Not Hispanic or Latino householder: Map | 17,192 | 4,823,358 | 103,254,926 |
| Hispanic or Latino householder: Map | 88 | 195,546 | 13,461,366 |
| HOUSEHOLDS, RACE OF HOUSEHOLDER | |||
| Householder who is White alone | 16,944 | 4,264,337 | 89,754,352 |
| Householder who is Black or African American alone | 181 | 498,966 | 14,129,983 |
| Householder who is American Indian and Alaska Native alone | 16 | 9,573 | 939,707 |
| Householder who is Asian alone | 36 | 109,060 | 4,632,164 |
| Householder who is Native Hawaiian and Other Pacific Islander alone | 0 | 1,127 | 143,932 |
| Householder who is Some Other Race alone | 13 | 82,237 | 4,916,427 |
| Householder who is Two or More Races | 90 | 53,604 | 2,199,727 |
| HOUSEHOLDS, HOUSEHOLD TYPE BY HOUSEHOLD SIZE | |||
| Family households: Map | 11,684 | 3,261,307 | 77,538,296 |
| 2-person household Map | 5,734 | 1,442,819 | 31,882,616 |
| 3-person household Map | 2,642 | 767,169 | 17,765,829 |
| 4-person household Map | 2,024 | 620,755 | 15,214,075 |
| 5-person household Map | 815 | 271,611 | 7,411,997 |
| 6-person household Map | 306 | 98,268 | 3,026,278 |
| 7-or-more-person household Map | 163 | 60,685 | 2,237,501 |
| Nonfamily households: Map | 5,596 | 1,757,597 | 39,177,996 |
| 1-person household Map | 4,769 | 1,433,415 | 31,204,909 |
| 2-person household Map | 679 | 262,684 | 6,360,012 |
| 3-person household Map | 86 | 36,955 | 992,156 |
| 4-person household Map | 37 | 16,687 | 411,171 |
| 5-person household Map | 14 | 4,799 | 126,634 |
| 6-person household Map | 7 | 1,720 | 48,421 |
| 7-or-more-person household Map | 4 | 1,337 | 34,693 |
| HOUSING UNITS | |||
| Total Housing Units Map | 22,365 | 5,567,315 | 131,704,730 |
| HOUSING UNITS, OCCUPANCY STATUS | |||
| Occupied Map | 17,280 | 5,018,904 | 116,716,292 |
| Vacant Map | 5,085 | 548,411 | 14,988,438 |
| HOUSING UNITS, OCCUPIED, TENURE | |||
| Owned with a mortgage or a loan Map | 7,316 | 2,268,674 | 52,979,430 |
| Owned free and clear Map | 5,820 | 1,223,048 | 23,006,644 |
| Renter occupied Map | 4,144 | 1,527,182 | 40,730,218 |
| HOUSING UNITS, VACANT, VACANCY STATUS | |||
| For rent Map | 286 | 135,262 | 4,137,567 |
| Rented, not occupied Map | 24 | 9,386 | 206,825 |
| For sale only Map | 205 | 64,818 | 1,896,796 |
| Sold, not occupied Map | 94 | 20,131 | 421,032 |
| For seasonal, recreational, or occasional use Map | 3,794 | 161,582 | 4,649,298 |
| For migrant workers Map | 3 | 411 | 24,161 |
| Other vacant Map | 679 | 156,821 | 3,652,759 |
| HOUSING UNITS, OCCUPIED, AVERAGE HOUSEHOLD SIZE BY TENURE | |||
| Total: Map | 2.39 | 2.45 | 2.58 |
| Owner occupied Map | 2.46 | 2.57 | 2.65 |
| Renter occupied Map | 2.17 | 2.16 | 2.44 |
| HOUSING UNITS, OCCUPIED, TENURE BY RACE OF HOUSEHOLDER | |||
| Owner occupied: Map | 13,136 | 3,491,722 | 75,986,074 |
| Householder who is White alone Map | 12,976 | 3,140,005 | 63,446,275 |
| Householder who is Black or African American alone Map | 79 | 228,851 | 6,261,464 |
| Householder who is American Indian and Alaska Native alone Map | 9 | 4,562 | 509,588 |
| Householder who is Asian alone Map | 21 | 62,204 | 2,688,861 |
| Householder who is Native Hawaiian and Other Pacific Islander alone Map | 0 | 544 | 61,911 |
| Householder who is Some Other Race alone Map | 8 | 30,761 | 1,975,817 |
| Householder who is Two or More Races Map | 43 | 24,795 | 1,042,158 |
| Renter occupied: Map | 4,144 | 1,527,182 | 40,730,218 |
| Householder who is White alone Map | 3,968 | 1,124,332 | 26,308,077 |
| Householder who is Black or African American alone Map | 102 | 270,115 | 7,868,519 |
| Householder who is American Indian and Alaska Native alone Map | 7 | 5,011 | 430,119 |
| Householder who is Asian alone Map | 15 | 46,856 | 1,943,303 |
| Householder who is Native Hawaiian and Other Pacific Islander alone Map | 0 | 583 | 82,021 |
| Householder who is Some Other Race alone Map | 5 | 51,476 | 2,940,610 |
| Householder who is Two or More Races Map | 47 | 28,809 | 1,157,569 |
| HOUSING UNITS, OCCUPIED, TENURE BY HISPANIC OR LATINO ORIGIN OF HOUSEHOLDER | |||
| Owner occupied: Map | 13,136 | 3,491,722 | 75,986,074 |
| Not Hispanic or Latino householder Map | 13,096 | 3,408,824 | 69,617,625 |
| Hispanic or Latino householder Map | 40 | 82,898 | 6,368,449 |
| Renter occupied: Map | 4,144 | 1,527,182 | 40,730,218 |
| Not Hispanic or Latino householder Map | 4,096 | 1,414,534 | 33,637,301 |
| Hispanic or Latino householder Map | 48 | 112,648 | 7,092,917 |
| HOUSING UNITS, OCCUPIED, TENURE BY HOUSEHOLD SIZE | |||
| Owner occupied: Map | 13,136 | 3,491,722 | 75,986,074 |
| 1-person household Map | 2,972 | 767,169 | 16,453,569 |
| 2-person household Map | 5,380 | 1,304,206 | 27,618,605 |
| 3-person household Map | 2,102 | 596,731 | 12,517,563 |
| 4-person household Map | 1,681 | 499,363 | 10,998,793 |
| 5-person household Map | 641 | 210,370 | 5,057,765 |
| 6-person household Map | 229 | 72,113 | 1,965,796 |
| 7-or-more-person household Map | 131 | 41,770 | 1,373,983 |
| Renter occupied: Map | 4,144 | 1,527,182 | 40,730,218 |
| 1-person household Map | 1,797 | 666,246 | 14,751,340 |
| 2-person household Map | 1,033 | 401,297 | 10,624,023 |
| 3-person household Map | 626 | 207,393 | 6,240,422 |
| 4-person household Map | 380 | 138,079 | 4,626,453 |
| 5-person household Map | 188 | 66,040 | 2,480,866 |
| 6-person household Map | 84 | 27,875 | 1,108,903 |
| 7-or-more-person household Map | 36 | 20,252 | 898,211 |
Loading...