


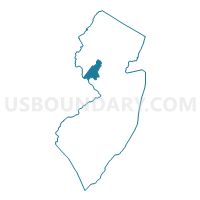
Hunterdon Central Regional School District, New Jersey
About
Outline

Summary
| Unique Area Identifier | 194894 |
| Name | Hunterdon Central Regional School District |
| State | New Jersey |
| Area (square miles) | 152.39 |
| Land Area (square miles) | 151.44 |
| Water Area (square miles) | 0.95 |
| % of Land Area | 99.37 |
| % of Water Area | 0.63 |
| Latitude of the Internal Point | 40.50050120 |
| Longtitude of the Internal Point | -74.85239800 |
| Total Population | 51,468 |
| Total Housing Units | 19,912 |
| Total Households | 19,148 |
| Median Age | 43.4 |
Maps
Graphs
Select a template below for downloading or customizing gragh for Hunterdon Central Regional School District, New Jersey


Neighbors
Neighoring Secondary School District (by Name) Neighboring Secondary School District on the Map
- Delaware Valley Regional School District, NJ
- North Hunterdon-Voorhees Regional School District, NJ
- South Hunterdon Regional School District, NJ
Top 10 Neighboring County (by Population) Neighboring County on the Map
- Bucks County, PA (625,249)
- Mercer County, NJ (366,513)
- Somerset County, NJ (323,444)
- Hunterdon County, NJ (128,349)
Top 10 Neighboring County Subdivision (by Population) Neighboring County Subdivision on the Map
- Hillsborough township, Somerset County, NJ (38,303)
- Montgomery township, Somerset County, NJ (22,254)
- Raritan township, Hunterdon County, NJ (22,185)
- Hopewell township, Mercer County, NJ (17,304)
- Readington township, Hunterdon County, NJ (16,126)
- Branchburg township, Somerset County, NJ (14,459)
- Clinton township, Hunterdon County, NJ (13,478)
- Plumstead township, Bucks County, PA (12,442)
- Solebury township, Bucks County, PA (8,692)
- Bedminster township, Somerset County, NJ (8,165)
Top 10 Neighboring Place (by Population) Neighboring Place on the Map
- Flemington borough, NJ (4,581)
- Lambertville city, NJ (3,906)
- White House Station CDP, NJ (2,089)
- Stockton borough, NJ (538)
Top 10 Neighboring Elementary School District (by Population) Neighboring Elementary School District on the Map
- Flemington-Raritan Regional School District, NJ (26,766)
- Readington Township School District, NJ (16,126)
- Branchburg Township School District, NJ (14,459)
- Clinton Township School District, NJ (13,478)
- Bedminster Township School District, NJ (8,165)
- Tewksbury Township School District, NJ (5,993)
- Delaware Township School District, NJ (4,563)
- East Amwell Township School District, NJ (4,013)
- Lambertville City School District, NJ (3,906)
- Kingwood Township School District, NJ (3,845)
Top 10 Neighboring Unified School District (by Population) Neighboring Unified School District on the Map
- Central Bucks School District, PA (114,377)
- Hillsborough Township School District, NJ (38,721)
- Montgomery Township School District, NJ (22,936)
- Hopewell Valley Regional School District, NJ (21,811)
- New Hope-Solebury School District, PA (11,220)
Top 10 Neighboring State Legislative District Lower Chamber (by Population) Neighboring State Legislative District Lower Chamber on the Map
- General Assembly District 23, NJ (229,972)
- General Assembly District 16, NJ (215,874)
- General Assembly District 24, NJ (215,703)
- General Assembly District 15, NJ (204,558)
- State House District 29, PA (66,505)
- State House District 143, PA (62,909)
Top 10 Neighboring State Legislative District Upper Chamber (by Population) Neighboring State Legislative District Upper Chamber on the Map
- State Senate District 10, PA (259,178)
- State Senate District 23, NJ (229,972)
- State Senate District 16, NJ (215,874)
- State Senate District 24, NJ (215,703)
- State Senate District 15, NJ (204,558)
Top 10 Neighboring 111th Congressional District (by Population) Neighboring 111th Congressional District on the Map
- Congressional District 12, NJ (701,881)
- Congressional District 7, NJ (672,885)
- Congressional District 8, PA (672,685)
Top 10 Neighboring Census Tract (by Population) Neighboring Census Tract on the Map
- Census Tract 113.02, Hunterdon County, NJ (7,263)
- Census Tract 112.01, Hunterdon County, NJ (7,235)
- Census Tract 110.02, Hunterdon County, NJ (7,135)
- Census Tract 38, Mercer County, NJ (6,746)
- Census Tract 113.01, Hunterdon County, NJ (6,554)
- Census Tract 110.01, Hunterdon County, NJ (6,343)
- Census Tract 536.02, Somerset County, NJ (6,097)
- Census Tract 101, Hunterdon County, NJ (5,993)
- Census Tract 111, Hunterdon County, NJ (5,416)
- Census Tract 115, Hunterdon County, NJ (5,218)
Top 10 Neighboring 5-Digit ZIP Code Tabulation Area (by Population) Neighboring 5-Digit ZIP Code Tabulation Area on the Map
- 08844, NJ (38,367)
- 08822, NJ (30,354)
- 08876, NJ (22,179)
- 18938, PA (13,989)
- 08889, NJ (10,063)
- 08833, NJ (8,796)
- 08801, NJ (8,551)
- 08530, NJ (8,071)
- 07921, NJ (7,621)
- 08558, NJ (6,629)
Data
Demographic, Population, Households, and Housing Units
** Data sources from census 2010 **
Show Data on Map
Download Full List as CSV
Download Quick Sheet as CSV
| Subject | This Area | New Jersey | National |
|---|---|---|---|
| POPULATION | |||
| Total Population Map | 51,468 | 8,791,894 | 308,745,538 |
| POPULATION, HISPANIC OR LATINO ORIGIN | |||
| Not Hispanic or Latino Map | 48,274 | 7,236,750 | 258,267,944 |
| Hispanic or Latino Map | 3,194 | 1,555,144 | 50,477,594 |
| POPULATION, RACE | |||
| White alone Map | 46,722 | 6,029,248 | 223,553,265 |
| Black or African American alone Map | 933 | 1,204,826 | 38,929,319 |
| American Indian and Alaska Native alone Map | 65 | 29,026 | 2,932,248 |
| Asian alone Map | 2,265 | 725,726 | 14,674,252 |
| Native Hawaiian and Other Pacific Islander alone Map | 11 | 3,043 | 540,013 |
| Some Other Race alone Map | 758 | 559,722 | 19,107,368 |
| Two or More Races Map | 714 | 240,303 | 9,009,073 |
| POPULATION, SEX | |||
| Male Map | 25,371 | 4,279,600 | 151,781,326 |
| Female Map | 26,097 | 4,512,294 | 156,964,212 |
| POPULATION, AGE (18 YEARS) | |||
| 18 years and over Map | 38,793 | 6,726,680 | 234,564,071 |
| Under 18 years | 12,675 | 2,065,214 | 74,181,467 |
| POPULATION, AGE | |||
| Under 5 years | 2,511 | 541,020 | 20,201,362 |
| 5 to 9 years | 3,568 | 564,750 | 20,348,657 |
| 10 to 14 years | 4,048 | 587,335 | 20,677,194 |
| 15 to 17 years | 2,548 | 372,109 | 12,954,254 |
| 18 and 19 years | 1,047 | 225,990 | 9,086,089 |
| 20 years | 387 | 108,760 | 4,519,129 |
| 21 years | 390 | 106,219 | 4,354,294 |
| 22 to 24 years | 1,340 | 326,259 | 12,712,576 |
| 25 to 29 years | 2,090 | 553,139 | 21,101,849 |
| 30 to 34 years | 2,078 | 556,662 | 19,962,099 |
| 35 to 39 years | 2,902 | 588,379 | 20,179,642 |
| 40 to 44 years | 4,301 | 649,918 | 20,890,964 |
| 45 to 49 years | 5,185 | 704,516 | 22,708,591 |
| 50 to 54 years | 5,047 | 674,680 | 22,298,125 |
| 55 to 59 years | 4,113 | 565,623 | 19,664,805 |
| 60 and 61 years | 1,366 | 201,084 | 7,113,727 |
| 62 to 64 years | 1,917 | 279,458 | 9,704,197 |
| 65 and 66 years | 934 | 149,028 | 5,319,902 |
| 67 to 69 years | 1,296 | 201,944 | 7,115,361 |
| 70 to 74 years | 1,398 | 260,462 | 9,278,166 |
| 75 to 79 years | 1,108 | 215,715 | 7,317,795 |
| 80 to 84 years | 923 | 179,233 | 5,743,327 |
| 85 years and over | 971 | 179,611 | 5,493,433 |
| MEDIAN AGE BY SEX | |||
| Both sexes Map | 43.40 | 39.00 | 37.20 |
| Male Map | 42.50 | 37.40 | 35.80 |
| Female Map | 44.20 | 40.30 | 38.50 |
| HOUSEHOLDS | |||
| Total Households Map | 19,148 | 3,214,360 | 116,716,292 |
| HOUSEHOLDS, HOUSEHOLD TYPE | |||
| Family households: Map | 14,049 | 2,226,606 | 77,538,296 |
| Husband-wife family Map | 12,055 | 1,643,377 | 56,510,377 |
| Other family: Map | 1,994 | 583,229 | 21,027,919 |
| Male householder, no wife present Map | 569 | 154,134 | 5,777,570 |
| Female householder, no husband present Map | 1,425 | 429,095 | 15,250,349 |
| Nonfamily households: Map | 5,099 | 987,754 | 39,177,996 |
| Householder living alone Map | 4,190 | 811,221 | 31,204,909 |
| Householder not living alone Map | 909 | 176,533 | 7,973,087 |
| HOUSEHOLDS, HISPANIC OR LATINO ORIGIN OF HOUSEHOLDER | |||
| Not Hispanic or Latino householder: Map | 18,334 | 2,777,617 | 103,254,926 |
| Hispanic or Latino householder: Map | 814 | 436,743 | 13,461,366 |
| HOUSEHOLDS, RACE OF HOUSEHOLDER | |||
| Householder who is White alone | 17,840 | 2,340,060 | 89,754,352 |
| Householder who is Black or African American alone | 297 | 428,304 | 14,129,983 |
| Householder who is American Indian and Alaska Native alone | 24 | 8,686 | 939,707 |
| Householder who is Asian alone | 679 | 223,319 | 4,632,164 |
| Householder who is Native Hawaiian and Other Pacific Islander alone | 2 | 925 | 143,932 |
| Householder who is Some Other Race alone | 160 | 152,495 | 4,916,427 |
| Householder who is Two or More Races | 146 | 60,571 | 2,199,727 |
| HOUSEHOLDS, HOUSEHOLD TYPE BY HOUSEHOLD SIZE | |||
| Family households: Map | 14,049 | 2,226,606 | 77,538,296 |
| 2-person household Map | 5,488 | 812,884 | 31,882,616 |
| 3-person household Map | 3,245 | 539,679 | 17,765,829 |
| 4-person household Map | 3,350 | 498,316 | 15,214,075 |
| 5-person household Map | 1,402 | 228,492 | 7,411,997 |
| 6-person household Map | 384 | 86,142 | 3,026,278 |
| 7-or-more-person household Map | 180 | 61,093 | 2,237,501 |
| Nonfamily households: Map | 5,099 | 987,754 | 39,177,996 |
| 1-person household Map | 4,190 | 811,221 | 31,204,909 |
| 2-person household Map | 791 | 144,798 | 6,360,012 |
| 3-person household Map | 66 | 18,350 | 992,156 |
| 4-person household Map | 30 | 7,791 | 411,171 |
| 5-person household Map | 15 | 3,235 | 126,634 |
| 6-person household Map | 5 | 1,302 | 48,421 |
| 7-or-more-person household Map | 2 | 1,057 | 34,693 |
| HOUSING UNITS | |||
| Total Housing Units Map | 19,912 | 3,553,562 | 131,704,730 |
| HOUSING UNITS, OCCUPANCY STATUS | |||
| Occupied Map | 19,148 | 3,214,360 | 116,716,292 |
| Vacant Map | 764 | 339,202 | 14,988,438 |
| HOUSING UNITS, OCCUPIED, TENURE | |||
| Owned with a mortgage or a loan Map | 12,370 | 1,532,012 | 52,979,430 |
| Owned free and clear Map | 3,702 | 570,453 | 23,006,644 |
| Renter occupied Map | 3,076 | 1,111,895 | 40,730,218 |
| HOUSING UNITS, VACANT, VACANCY STATUS | |||
| For rent Map | 165 | 92,118 | 4,137,567 |
| Rented, not occupied Map | 15 | 4,578 | 206,825 |
| For sale only Map | 188 | 39,260 | 1,896,796 |
| Sold, not occupied Map | 52 | 8,145 | 421,032 |
| For seasonal, recreational, or occasional use Map | 142 | 134,903 | 4,649,298 |
| For migrant workers Map | 0 | 156 | 24,161 |
| Other vacant Map | 202 | 60,042 | 3,652,759 |
| HOUSING UNITS, OCCUPIED, AVERAGE HOUSEHOLD SIZE BY TENURE | |||
| Total: Map | 2.66 | 2.68 | 2.58 |
| Owner occupied Map | 2.76 | 2.79 | 2.65 |
| Renter occupied Map | 2.19 | 2.47 | 2.44 |
| HOUSING UNITS, OCCUPIED, TENURE BY RACE OF HOUSEHOLDER | |||
| Owner occupied: Map | 16,072 | 2,102,465 | 75,986,074 |
| Householder who is White alone Map | 15,168 | 1,717,602 | 63,446,275 |
| Householder who is Black or African American alone Map | 185 | 171,748 | 6,261,464 |
| Householder who is American Indian and Alaska Native alone Map | 11 | 3,523 | 509,588 |
| Householder who is Asian alone Map | 573 | 137,287 | 2,688,861 |
| Householder who is Native Hawaiian and Other Pacific Islander alone Map | 1 | 375 | 61,911 |
| Householder who is Some Other Race alone Map | 42 | 45,382 | 1,975,817 |
| Householder who is Two or More Races Map | 92 | 26,548 | 1,042,158 |
| Renter occupied: Map | 3,076 | 1,111,895 | 40,730,218 |
| Householder who is White alone Map | 2,672 | 622,458 | 26,308,077 |
| Householder who is Black or African American alone Map | 112 | 256,556 | 7,868,519 |
| Householder who is American Indian and Alaska Native alone Map | 13 | 5,163 | 430,119 |
| Householder who is Asian alone Map | 106 | 86,032 | 1,943,303 |
| Householder who is Native Hawaiian and Other Pacific Islander alone Map | 1 | 550 | 82,021 |
| Householder who is Some Other Race alone Map | 118 | 107,113 | 2,940,610 |
| Householder who is Two or More Races Map | 54 | 34,023 | 1,157,569 |
| HOUSING UNITS, OCCUPIED, TENURE BY HISPANIC OR LATINO ORIGIN OF HOUSEHOLDER | |||
| Owner occupied: Map | 16,072 | 2,102,465 | 75,986,074 |
| Not Hispanic or Latino householder Map | 15,654 | 1,943,837 | 69,617,625 |
| Hispanic or Latino householder Map | 418 | 158,628 | 6,368,449 |
| Renter occupied: Map | 3,076 | 1,111,895 | 40,730,218 |
| Not Hispanic or Latino householder Map | 2,680 | 833,780 | 33,637,301 |
| Hispanic or Latino householder Map | 396 | 278,115 | 7,092,917 |
| HOUSING UNITS, OCCUPIED, TENURE BY HOUSEHOLD SIZE | |||
| Owner occupied: Map | 16,072 | 2,102,465 | 75,986,074 |
| 1-person household Map | 2,798 | 418,027 | 16,453,569 |
| 2-person household Map | 5,523 | 671,621 | 27,618,605 |
| 3-person household Map | 2,946 | 378,218 | 12,517,563 |
| 4-person household Map | 3,087 | 373,606 | 10,998,793 |
| 5-person household Map | 1,255 | 166,068 | 5,057,765 |
| 6-person household Map | 334 | 58,752 | 1,965,796 |
| 7-or-more-person household Map | 129 | 36,173 | 1,373,983 |
| Renter occupied: Map | 3,076 | 1,111,895 | 40,730,218 |
| 1-person household Map | 1,392 | 393,194 | 14,751,340 |
| 2-person household Map | 756 | 286,061 | 10,624,023 |
| 3-person household Map | 365 | 179,811 | 6,240,422 |
| 4-person household Map | 293 | 132,501 | 4,626,453 |
| 5-person household Map | 162 | 65,659 | 2,480,866 |
| 6-person household Map | 55 | 28,692 | 1,108,903 |
| 7-or-more-person household Map | 53 | 25,977 | 898,211 |
Loading...