


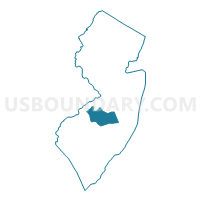
Lenape Regional School District, New Jersey
About
Outline

Summary
| Unique Area Identifier | 194879 |
| Name | Lenape Regional School District |
| State | New Jersey |
| Area (square miles) | 328.12 |
| Land Area (square miles) | 322.80 |
| Water Area (square miles) | 5.32 |
| % of Land Area | 98.38 |
| % of Water Area | 1.62 |
| Latitude of the Internal Point | 39.85022540 |
| Longtitude of the Internal Point | -74.68618280 |
| Total Population | 140,272 |
| Total Housing Units | 56,937 |
| Total Households | 54,683 |
| Median Age | 42.6 |
Maps
Graphs
Select a template below for downloading or customizing gragh for Lenape Regional School District, New Jersey


Neighbors
Neighoring Secondary School District (by Name) Neighboring Secondary School District on the Map
- Eastern Camden County Regional School District, NJ
- Pinelands Regional School District, NJ
- Rancocas Valley Regional School District, NJ
Top 10 Neighboring County (by Population) Neighboring County on the Map
- Ocean County, NJ (576,567)
- Camden County, NJ (513,657)
- Burlington County, NJ (448,734)
- Atlantic County, NJ (274,549)
Top 10 Neighboring County Subdivision (by Population) Neighboring County Subdivision on the Map
- Cherry Hill township, Camden County, NJ (71,045)
- Evesham township, Burlington County, NJ (45,538)
- Manchester township, Ocean County, NJ (43,070)
- Mount Laurel township, Burlington County, NJ (41,864)
- Willingboro township, Burlington County, NJ (31,629)
- Voorhees township, Camden County, NJ (29,131)
- Pemberton township, Burlington County, NJ (27,912)
- Lacey township, Ocean County, NJ (27,644)
- Medford township, Burlington County, NJ (23,033)
- Barnegat township, Ocean County, NJ (20,936)
Top 10 Neighboring Place (by Population) Neighboring Place on the Map
- Hammonton town, NJ (14,791)
- Moorestown-Lenola CDP, NJ (14,217)
- Greentree CDP, NJ (11,367)
- Marlton CDP, NJ (10,133)
- Ramblewood CDP, NJ (5,907)
- Kingston Estates CDP, NJ (5,685)
- Medford Lakes borough, NJ (4,146)
- Leisuretowne CDP, NJ (3,582)
- Presidential Lakes Estates CDP, NJ (2,365)
Top 10 Neighboring Elementary School District (by Population) Neighboring Elementary School District on the Map
- Evesham Township School District, NJ (45,538)
- Mount Laurel Township School District, NJ (41,864)
- Voorhees Township School District, NJ (29,131)
- Medford Township School District, NJ (23,033)
- Barnegat Township School District, NJ (20,936)
- Little Egg Harbor Township School District, NJ (20,065)
- Lumberton Township School District, NJ (12,559)
- Waterford Township School District, NJ (10,649)
- Southampton Township School District, NJ (10,464)
- Westampton Township School District, NJ (8,813)
Top 10 Neighboring Unified School District (by Population) Neighboring Unified School District on the Map
- Cherry Hill Township School District, NJ (71,045)
- Manchester Township School District, NJ (43,070)
- Willingboro Township School District, NJ (31,629)
- Pemberton Township School District, NJ (29,321)
- Lacey Township School District, NJ (27,644)
- Moorestown Township School District, NJ (20,726)
- Maple Shade Township School District, NJ (19,131)
- Hammonton Town School District, NJ (14,791)
Top 10 Neighboring State Legislative District Lower Chamber (by Population) Neighboring State Legislative District Lower Chamber on the Map
- General Assembly District 9, NJ (236,923)
- General Assembly District 8, NJ (227,817)
- General Assembly District 6, NJ (222,700)
- General Assembly District 7, NJ (219,914)
Top 10 Neighboring State Legislative District Upper Chamber (by Population) Neighboring State Legislative District Upper Chamber on the Map
- State Senate District 9, NJ (236,923)
- State Senate District 8, NJ (227,817)
- State Senate District 6, NJ (222,700)
- State Senate District 7, NJ (219,914)
Top 10 Neighboring 111th Congressional District (by Population) Neighboring 111th Congressional District on the Map
- Congressional District 4, NJ (724,596)
- Congressional District 2, NJ (692,205)
- Congressional District 3, NJ (680,341)
- Congressional District 1, NJ (669,169)
Top 10 Neighboring Census Tract (by Population) Neighboring Census Tract on the Map
- Census Tract 7027, Burlington County, NJ (8,813)
- Census Tract 7040.14, Burlington County, NJ (7,855)
- Census Tract 7038.04, Burlington County, NJ (7,244)
- Census Tract 7340.01, Ocean County, NJ (7,185)
- Census Tract 7022.08, Burlington County, NJ (7,064)
- Census Tract 7038.01, Burlington County, NJ (6,998)
- Census Tract 7036, Burlington County, NJ (6,946)
- Census Tract 6034, Camden County, NJ (6,920)
- Census Tract 6075.03, Camden County, NJ (6,540)
- Census Tract 7037, Burlington County, NJ (6,493)
Top 10 Neighboring 5-Digit ZIP Code Tabulation Area (by Population) Neighboring 5-Digit ZIP Code Tabulation Area on the Map
- 08053, NJ (45,538)
- 08054, NJ (41,864)
- 08759, NJ (33,263)
- 08046, NJ (31,587)
- 08003, NJ (30,629)
- 08043, NJ (29,131)
- 08055, NJ (27,179)
- 08060, NJ (24,713)
- 08088, NJ (24,664)
- 08037, NJ (24,308)
Data
Demographic, Population, Households, and Housing Units
** Data sources from census 2010 **
Show Data on Map
Download Full List as CSV
Download Quick Sheet as CSV
| Subject | This Area | New Jersey | National |
|---|---|---|---|
| POPULATION | |||
| Total Population Map | 140,272 | 8,791,894 | 308,745,538 |
| POPULATION, HISPANIC OR LATINO ORIGIN | |||
| Not Hispanic or Latino Map | 135,501 | 7,236,750 | 258,267,944 |
| Hispanic or Latino Map | 4,771 | 1,555,144 | 50,477,594 |
| POPULATION, RACE | |||
| White alone Map | 123,052 | 6,029,248 | 223,553,265 |
| Black or African American alone Map | 6,875 | 1,204,826 | 38,929,319 |
| American Indian and Alaska Native alone Map | 195 | 29,026 | 2,932,248 |
| Asian alone Map | 6,591 | 725,726 | 14,674,252 |
| Native Hawaiian and Other Pacific Islander alone Map | 38 | 3,043 | 540,013 |
| Some Other Race alone Map | 1,062 | 559,722 | 19,107,368 |
| Two or More Races Map | 2,459 | 240,303 | 9,009,073 |
| POPULATION, SEX | |||
| Male Map | 67,158 | 4,279,600 | 151,781,326 |
| Female Map | 73,114 | 4,512,294 | 156,964,212 |
| POPULATION, AGE (18 YEARS) | |||
| 18 years and over Map | 107,838 | 6,726,680 | 234,564,071 |
| Under 18 years | 32,434 | 2,065,214 | 74,181,467 |
| POPULATION, AGE | |||
| Under 5 years | 7,225 | 541,020 | 20,201,362 |
| 5 to 9 years | 8,817 | 564,750 | 20,348,657 |
| 10 to 14 years | 9,998 | 587,335 | 20,677,194 |
| 15 to 17 years | 6,394 | 372,109 | 12,954,254 |
| 18 and 19 years | 3,066 | 225,990 | 9,086,089 |
| 20 years | 1,174 | 108,760 | 4,519,129 |
| 21 years | 1,174 | 106,219 | 4,354,294 |
| 22 to 24 years | 4,043 | 326,259 | 12,712,576 |
| 25 to 29 years | 6,961 | 553,139 | 21,101,849 |
| 30 to 34 years | 7,190 | 556,662 | 19,962,099 |
| 35 to 39 years | 8,689 | 588,379 | 20,179,642 |
| 40 to 44 years | 10,778 | 649,918 | 20,890,964 |
| 45 to 49 years | 12,566 | 704,516 | 22,708,591 |
| 50 to 54 years | 11,951 | 674,680 | 22,298,125 |
| 55 to 59 years | 9,922 | 565,623 | 19,664,805 |
| 60 and 61 years | 3,605 | 201,084 | 7,113,727 |
| 62 to 64 years | 5,265 | 279,458 | 9,704,197 |
| 65 and 66 years | 2,766 | 149,028 | 5,319,902 |
| 67 to 69 years | 3,872 | 201,944 | 7,115,361 |
| 70 to 74 years | 4,690 | 260,462 | 9,278,166 |
| 75 to 79 years | 3,894 | 215,715 | 7,317,795 |
| 80 to 84 years | 3,226 | 179,233 | 5,743,327 |
| 85 years and over | 3,006 | 179,611 | 5,493,433 |
| MEDIAN AGE BY SEX | |||
| Both sexes Map | 42.60 | 39.00 | 37.20 |
| Male Map | 41.30 | 37.40 | 35.80 |
| Female Map | 43.70 | 40.30 | 38.50 |
| HOUSEHOLDS | |||
| Total Households Map | 54,683 | 3,214,360 | 116,716,292 |
| HOUSEHOLDS, HOUSEHOLD TYPE | |||
| Family households: Map | 38,444 | 2,226,606 | 77,538,296 |
| Husband-wife family Map | 31,645 | 1,643,377 | 56,510,377 |
| Other family: Map | 6,799 | 583,229 | 21,027,919 |
| Male householder, no wife present Map | 1,700 | 154,134 | 5,777,570 |
| Female householder, no husband present Map | 5,099 | 429,095 | 15,250,349 |
| Nonfamily households: Map | 16,239 | 987,754 | 39,177,996 |
| Householder living alone Map | 13,754 | 811,221 | 31,204,909 |
| Householder not living alone Map | 2,485 | 176,533 | 7,973,087 |
| HOUSEHOLDS, HISPANIC OR LATINO ORIGIN OF HOUSEHOLDER | |||
| Not Hispanic or Latino householder: Map | 53,377 | 2,777,617 | 103,254,926 |
| Hispanic or Latino householder: Map | 1,306 | 436,743 | 13,461,366 |
| HOUSEHOLDS, RACE OF HOUSEHOLDER | |||
| Householder who is White alone | 49,001 | 2,340,060 | 89,754,352 |
| Householder who is Black or African American alone | 2,646 | 428,304 | 14,129,983 |
| Householder who is American Indian and Alaska Native alone | 67 | 8,686 | 939,707 |
| Householder who is Asian alone | 2,101 | 223,319 | 4,632,164 |
| Householder who is Native Hawaiian and Other Pacific Islander alone | 15 | 925 | 143,932 |
| Householder who is Some Other Race alone | 321 | 152,495 | 4,916,427 |
| Householder who is Two or More Races | 532 | 60,571 | 2,199,727 |
| HOUSEHOLDS, HOUSEHOLD TYPE BY HOUSEHOLD SIZE | |||
| Family households: Map | 38,444 | 2,226,606 | 77,538,296 |
| 2-person household Map | 15,898 | 812,884 | 31,882,616 |
| 3-person household Map | 9,048 | 539,679 | 17,765,829 |
| 4-person household Map | 8,577 | 498,316 | 15,214,075 |
| 5-person household Map | 3,506 | 228,492 | 7,411,997 |
| 6-person household Map | 1,018 | 86,142 | 3,026,278 |
| 7-or-more-person household Map | 397 | 61,093 | 2,237,501 |
| Nonfamily households: Map | 16,239 | 987,754 | 39,177,996 |
| 1-person household Map | 13,754 | 811,221 | 31,204,909 |
| 2-person household Map | 2,228 | 144,798 | 6,360,012 |
| 3-person household Map | 185 | 18,350 | 992,156 |
| 4-person household Map | 49 | 7,791 | 411,171 |
| 5-person household Map | 19 | 3,235 | 126,634 |
| 6-person household Map | 2 | 1,302 | 48,421 |
| 7-or-more-person household Map | 2 | 1,057 | 34,693 |
| HOUSING UNITS | |||
| Total Housing Units Map | 56,937 | 3,553,562 | 131,704,730 |
| HOUSING UNITS, OCCUPANCY STATUS | |||
| Occupied Map | 54,683 | 3,214,360 | 116,716,292 |
| Vacant Map | 2,254 | 339,202 | 14,988,438 |
| HOUSING UNITS, OCCUPIED, TENURE | |||
| Owned with a mortgage or a loan Map | 34,607 | 1,532,012 | 52,979,430 |
| Owned free and clear Map | 11,343 | 570,453 | 23,006,644 |
| Renter occupied Map | 8,733 | 1,111,895 | 40,730,218 |
| HOUSING UNITS, VACANT, VACANCY STATUS | |||
| For rent Map | 721 | 92,118 | 4,137,567 |
| Rented, not occupied Map | 37 | 4,578 | 206,825 |
| For sale only Map | 609 | 39,260 | 1,896,796 |
| Sold, not occupied Map | 113 | 8,145 | 421,032 |
| For seasonal, recreational, or occasional use Map | 249 | 134,903 | 4,649,298 |
| For migrant workers Map | 2 | 156 | 24,161 |
| Other vacant Map | 523 | 60,042 | 3,652,759 |
| HOUSING UNITS, OCCUPIED, AVERAGE HOUSEHOLD SIZE BY TENURE | |||
| Total: Map | 2.54 | 2.68 | 2.58 |
| Owner occupied Map | 2.64 | 2.79 | 2.65 |
| Renter occupied Map | 2.04 | 2.47 | 2.44 |
| HOUSING UNITS, OCCUPIED, TENURE BY RACE OF HOUSEHOLDER | |||
| Owner occupied: Map | 45,950 | 2,102,465 | 75,986,074 |
| Householder who is White alone Map | 42,152 | 1,717,602 | 63,446,275 |
| Householder who is Black or African American alone Map | 1,589 | 171,748 | 6,261,464 |
| Householder who is American Indian and Alaska Native alone Map | 46 | 3,523 | 509,588 |
| Householder who is Asian alone Map | 1,636 | 137,287 | 2,688,861 |
| Householder who is Native Hawaiian and Other Pacific Islander alone Map | 10 | 375 | 61,911 |
| Householder who is Some Other Race alone Map | 159 | 45,382 | 1,975,817 |
| Householder who is Two or More Races Map | 358 | 26,548 | 1,042,158 |
| Renter occupied: Map | 8,733 | 1,111,895 | 40,730,218 |
| Householder who is White alone Map | 6,849 | 622,458 | 26,308,077 |
| Householder who is Black or African American alone Map | 1,057 | 256,556 | 7,868,519 |
| Householder who is American Indian and Alaska Native alone Map | 21 | 5,163 | 430,119 |
| Householder who is Asian alone Map | 465 | 86,032 | 1,943,303 |
| Householder who is Native Hawaiian and Other Pacific Islander alone Map | 5 | 550 | 82,021 |
| Householder who is Some Other Race alone Map | 162 | 107,113 | 2,940,610 |
| Householder who is Two or More Races Map | 174 | 34,023 | 1,157,569 |
| HOUSING UNITS, OCCUPIED, TENURE BY HISPANIC OR LATINO ORIGIN OF HOUSEHOLDER | |||
| Owner occupied: Map | 45,950 | 2,102,465 | 75,986,074 |
| Not Hispanic or Latino householder Map | 45,090 | 1,943,837 | 69,617,625 |
| Hispanic or Latino householder Map | 860 | 158,628 | 6,368,449 |
| Renter occupied: Map | 8,733 | 1,111,895 | 40,730,218 |
| Not Hispanic or Latino householder Map | 8,287 | 833,780 | 33,637,301 |
| Hispanic or Latino householder Map | 446 | 278,115 | 7,092,917 |
| HOUSING UNITS, OCCUPIED, TENURE BY HOUSEHOLD SIZE | |||
| Owner occupied: Map | 45,950 | 2,102,465 | 75,986,074 |
| 1-person household Map | 10,016 | 418,027 | 16,453,569 |
| 2-person household Map | 15,461 | 671,621 | 27,618,605 |
| 3-person household Map | 8,054 | 378,218 | 12,517,563 |
| 4-person household Map | 7,882 | 373,606 | 10,998,793 |
| 5-person household Map | 3,260 | 166,068 | 5,057,765 |
| 6-person household Map | 921 | 58,752 | 1,965,796 |
| 7-or-more-person household Map | 356 | 36,173 | 1,373,983 |
| Renter occupied: Map | 8,733 | 1,111,895 | 40,730,218 |
| 1-person household Map | 3,738 | 393,194 | 14,751,340 |
| 2-person household Map | 2,665 | 286,061 | 10,624,023 |
| 3-person household Map | 1,179 | 179,811 | 6,240,422 |
| 4-person household Map | 744 | 132,501 | 4,626,453 |
| 5-person household Map | 265 | 65,659 | 2,480,866 |
| 6-person household Map | 99 | 28,692 | 1,108,903 |
| 7-or-more-person household Map | 43 | 25,977 | 898,211 |
Loading...