


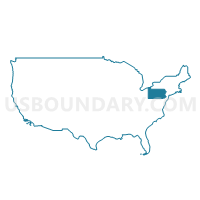
State House District 9, Pennsylvania
About
Outline

Summary
| Unique Area Identifier | 198539 |
| Name | State House District 9 |
| State | Pennsylvania |
| Area (square miles) | 195.84 |
| Land Area (square miles) | 193.20 |
| Water Area (square miles) | 2.64 |
| % of Land Area | 98.65 |
| % of Water Area | 1.35 |
| Latitude of the Internal Point | 40.97269480 |
| Longtitude of the Internal Point | -80.43125330 |
| Total Population | 56,261 |
| Total Housing Units | 26,086 |
| Total Households | 23,403 |
| Median Age | 44.1 |
Maps

Graphs
Select a template below for downloading or customizing gragh for State House District 9, Pennsylvania


Neighbors
Neighoring State Legislative District Lower Chamber (by Name) Neighboring State Legislative District Lower Chamber on the Map
- State House District 1, OH
- State House District 10, PA
- State House District 14, PA
- State House District 17, PA
- State House District 59, OH
- State House District 60, OH
- State House District 61, OH
- State House District 7, PA
Top 10 Neighboring County (by Population) Neighboring County on the Map
- Mahoning County, OH (238,823)
- Beaver County, PA (170,539)
- Mercer County, PA (116,638)
- Columbiana County, OH (107,841)
- Lawrence County, PA (91,108)
Top 10 Neighboring County Subdivision (by Population) Neighboring County Subdivision on the Map
- New Castle city, Lawrence County, PA (23,273)
- Poland township, Mahoning County, OH (14,960)
- Unity township, Columbiana County, OH (9,957)
- Neshannock township, Lawrence County, PA (9,609)
- Chippewa township, Beaver County, PA (7,620)
- Shenango township, Lawrence County, PA (7,479)
- Springfield township, Mahoning County, OH (6,703)
- Union township, Lawrence County, PA (5,190)
- North Beaver township, Lawrence County, PA (4,121)
- Shenango township, Mercer County, PA (3,929)
Top 10 Neighboring Place (by Population) Neighboring Place on the Map
- New Castle city, PA (23,273)
- Oakwood CDP, PA (2,270)
- Big Beaver borough, PA (1,970)
- Oakland CDP, PA (1,569)
- New Beaver borough, PA (1,502)
- New Castle Northwest CDP, PA (1,413)
- Bessemer borough, PA (1,111)
- New Bedford CDP, PA (925)
- South New Castle borough, PA (709)
- Frizzleburg CDP, PA (602)
Top 10 Neighboring Unified School District (by Population) Neighboring Unified School District on the Map
- Youngstown City School District, OH (69,017)
- New Castle Area School District, PA (24,323)
- Blackhawk School District, PA (17,762)
- Poland Local School District, OH (15,352)
- Ellwood City Area School District, PA (14,362)
- Big Beaver Falls Area School District, PA (13,827)
- Wilmington Area School District, PA (11,828)
- Mohawk Area School District, PA (10,867)
- Neshannock Township School District, PA (9,609)
- East Palestine City School District, OH (8,285)
Top 10 Neighboring State Legislative District Upper Chamber (by Population) Neighboring State Legislative District Upper Chamber on the Map
- State Senate District 30, OH (338,710)
- State Senate District 33, OH (323,425)
- State Senate District 50, PA (235,966)
- State Senate District 47, PA (225,797)
Top 10 Neighboring 111th Congressional District (by Population) Neighboring 111th Congressional District on the Map
- Congressional District 4, PA (647,418)
- Congressional District 3, PA (640,356)
- Congressional District 6, OH (623,742)
- Congressional District 17, OH (600,111)
Top 10 Neighboring Census Tract (by Population) Neighboring Census Tract on the Map
- Census Tract 8136, Mahoning County, OH (8,324)
- Census Tract 9514, Columbiana County, OH (7,652)
- Census Tract 6007, Beaver County, PA (7,620)
- Census Tract 8110.02, Mahoning County, OH (7,499)
- Census Tract 108, Lawrence County, PA (6,216)
- Census Tract 9501, Columbiana County, OH (5,712)
- Census Tract 102.02, Lawrence County, PA (5,185)
- Census Tract 110, Lawrence County, PA (5,031)
- Census Tract 331, Mercer County, PA (4,810)
- Census Tract 327.01, Mercer County, PA (4,792)
Top 10 Neighboring 5-Digit ZIP Code Tabulation Area (by Population) Neighboring 5-Digit ZIP Code Tabulation Area on the Map
- 16101, PA (34,042)
- 15010, PA (28,425)
- 16117, PA (17,185)
- 16105, PA (15,448)
- 44425, OH (14,898)
- 44413, OH (7,261)
- 16142, PA (7,056)
- 16102, PA (5,755)
- 16159, PA (4,706)
- 44442, OH (4,006)
Data
Demographic, Population, Households, and Housing Units
** Data sources from census 2010 **
Show Data on Map
Download Full List as CSV
Download Quick Sheet as CSV
| Subject | This Area | Pennsylvania | National |
|---|---|---|---|
| POPULATION | |||
| Total Population Map | 56,261 | 12,702,379 | 308,745,538 |
| POPULATION, HISPANIC OR LATINO ORIGIN | |||
| Not Hispanic or Latino Map | 55,622 | 11,982,719 | 258,267,944 |
| Hispanic or Latino Map | 639 | 719,660 | 50,477,594 |
| POPULATION, RACE | |||
| White alone Map | 51,368 | 10,406,288 | 223,553,265 |
| Black or African American alone Map | 3,250 | 1,377,689 | 38,929,319 |
| American Indian and Alaska Native alone Map | 51 | 26,843 | 2,932,248 |
| Asian alone Map | 267 | 349,088 | 14,674,252 |
| Native Hawaiian and Other Pacific Islander alone Map | 4 | 3,653 | 540,013 |
| Some Other Race alone Map | 155 | 300,983 | 19,107,368 |
| Two or More Races Map | 1,166 | 237,835 | 9,009,073 |
| POPULATION, SEX | |||
| Male Map | 26,972 | 6,190,363 | 151,781,326 |
| Female Map | 29,289 | 6,512,016 | 156,964,212 |
| POPULATION, AGE (18 YEARS) | |||
| 18 years and over Map | 44,205 | 9,910,224 | 234,564,071 |
| Under 18 years | 12,056 | 2,792,155 | 74,181,467 |
| POPULATION, AGE | |||
| Under 5 years | 3,179 | 729,538 | 20,201,362 |
| 5 to 9 years | 3,208 | 753,635 | 20,348,657 |
| 10 to 14 years | 3,438 | 791,151 | 20,677,194 |
| 15 to 17 years | 2,231 | 517,831 | 12,954,254 |
| 18 and 19 years | 1,295 | 387,235 | 9,086,089 |
| 20 years | 526 | 191,942 | 4,519,129 |
| 21 years | 538 | 183,257 | 4,354,294 |
| 22 to 24 years | 1,718 | 498,947 | 12,712,576 |
| 25 to 29 years | 2,932 | 781,527 | 21,101,849 |
| 30 to 34 years | 2,964 | 729,592 | 19,962,099 |
| 35 to 39 years | 3,212 | 764,287 | 20,179,642 |
| 40 to 44 years | 3,543 | 851,382 | 20,890,964 |
| 45 to 49 years | 4,045 | 955,763 | 22,708,591 |
| 50 to 54 years | 4,569 | 984,641 | 22,298,125 |
| 55 to 59 years | 4,225 | 879,048 | 19,664,805 |
| 60 and 61 years | 1,600 | 312,575 | 7,113,727 |
| 62 to 64 years | 2,107 | 430,721 | 9,704,197 |
| 65 and 66 years | 1,138 | 231,623 | 5,319,902 |
| 67 to 69 years | 1,608 | 321,379 | 7,115,361 |
| 70 to 74 years | 2,340 | 426,536 | 9,278,166 |
| 75 to 79 years | 2,102 | 362,332 | 7,317,795 |
| 80 to 84 years | 1,877 | 311,761 | 5,743,327 |
| 85 years and over | 1,866 | 305,676 | 5,493,433 |
| MEDIAN AGE BY SEX | |||
| Both sexes Map | 44.10 | 40.10 | 37.20 |
| Male Map | 42.10 | 38.70 | 35.80 |
| Female Map | 45.90 | 41.50 | 38.50 |
| HOUSEHOLDS | |||
| Total Households Map | 23,403 | 5,018,904 | 116,716,292 |
| HOUSEHOLDS, HOUSEHOLD TYPE | |||
| Family households: Map | 15,357 | 3,261,307 | 77,538,296 |
| Husband-wife family Map | 11,005 | 2,417,765 | 56,510,377 |
| Other family: Map | 4,352 | 843,542 | 21,027,919 |
| Male householder, no wife present Map | 1,166 | 229,495 | 5,777,570 |
| Female householder, no husband present Map | 3,186 | 614,047 | 15,250,349 |
| Nonfamily households: Map | 8,046 | 1,757,597 | 39,177,996 |
| Householder living alone Map | 7,063 | 1,433,415 | 31,204,909 |
| Householder not living alone Map | 983 | 324,182 | 7,973,087 |
| HOUSEHOLDS, HISPANIC OR LATINO ORIGIN OF HOUSEHOLDER | |||
| Not Hispanic or Latino householder: Map | 23,236 | 4,823,358 | 103,254,926 |
| Hispanic or Latino householder: Map | 167 | 195,546 | 13,461,366 |
| HOUSEHOLDS, RACE OF HOUSEHOLDER | |||
| Householder who is White alone | 21,915 | 4,264,337 | 89,754,352 |
| Householder who is Black or African American alone | 1,177 | 498,966 | 14,129,983 |
| Householder who is American Indian and Alaska Native alone | 28 | 9,573 | 939,707 |
| Householder who is Asian alone | 65 | 109,060 | 4,632,164 |
| Householder who is Native Hawaiian and Other Pacific Islander alone | 0 | 1,127 | 143,932 |
| Householder who is Some Other Race alone | 27 | 82,237 | 4,916,427 |
| Householder who is Two or More Races | 191 | 53,604 | 2,199,727 |
| HOUSEHOLDS, HOUSEHOLD TYPE BY HOUSEHOLD SIZE | |||
| Family households: Map | 15,357 | 3,261,307 | 77,538,296 |
| 2-person household Map | 7,265 | 1,442,819 | 31,882,616 |
| 3-person household Map | 3,615 | 767,169 | 17,765,829 |
| 4-person household Map | 2,669 | 620,755 | 15,214,075 |
| 5-person household Map | 1,187 | 271,611 | 7,411,997 |
| 6-person household Map | 426 | 98,268 | 3,026,278 |
| 7-or-more-person household Map | 195 | 60,685 | 2,237,501 |
| Nonfamily households: Map | 8,046 | 1,757,597 | 39,177,996 |
| 1-person household Map | 7,063 | 1,433,415 | 31,204,909 |
| 2-person household Map | 839 | 262,684 | 6,360,012 |
| 3-person household Map | 80 | 36,955 | 992,156 |
| 4-person household Map | 45 | 16,687 | 411,171 |
| 5-person household Map | 13 | 4,799 | 126,634 |
| 6-person household Map | 3 | 1,720 | 48,421 |
| 7-or-more-person household Map | 3 | 1,337 | 34,693 |
| HOUSING UNITS | |||
| Total Housing Units Map | 26,086 | 5,567,315 | 131,704,730 |
| HOUSING UNITS, OCCUPANCY STATUS | |||
| Occupied Map | 23,403 | 5,018,904 | 116,716,292 |
| Vacant Map | 2,683 | 548,411 | 14,988,438 |
| HOUSING UNITS, OCCUPIED, TENURE | |||
| Owned with a mortgage or a loan Map | 9,883 | 2,268,674 | 52,979,430 |
| Owned free and clear Map | 7,285 | 1,223,048 | 23,006,644 |
| Renter occupied Map | 6,235 | 1,527,182 | 40,730,218 |
| HOUSING UNITS, VACANT, VACANCY STATUS | |||
| For rent Map | 850 | 135,262 | 4,137,567 |
| Rented, not occupied Map | 32 | 9,386 | 206,825 |
| For sale only Map | 493 | 64,818 | 1,896,796 |
| Sold, not occupied Map | 197 | 20,131 | 421,032 |
| For seasonal, recreational, or occasional use Map | 287 | 161,582 | 4,649,298 |
| For migrant workers Map | 0 | 411 | 24,161 |
| Other vacant Map | 824 | 156,821 | 3,652,759 |
| HOUSING UNITS, OCCUPIED, AVERAGE HOUSEHOLD SIZE BY TENURE | |||
| Total: Map | 2.37 | 2.45 | 2.58 |
| Owner occupied Map | 2.46 | 2.57 | 2.65 |
| Renter occupied Map | 2.10 | 2.16 | 2.44 |
| HOUSING UNITS, OCCUPIED, TENURE BY RACE OF HOUSEHOLDER | |||
| Owner occupied: Map | 17,168 | 3,491,722 | 75,986,074 |
| Householder who is White alone Map | 16,532 | 3,140,005 | 63,446,275 |
| Householder who is Black or African American alone Map | 470 | 228,851 | 6,261,464 |
| Householder who is American Indian and Alaska Native alone Map | 15 | 4,562 | 509,588 |
| Householder who is Asian alone Map | 52 | 62,204 | 2,688,861 |
| Householder who is Native Hawaiian and Other Pacific Islander alone Map | 0 | 544 | 61,911 |
| Householder who is Some Other Race alone Map | 14 | 30,761 | 1,975,817 |
| Householder who is Two or More Races Map | 85 | 24,795 | 1,042,158 |
| Renter occupied: Map | 6,235 | 1,527,182 | 40,730,218 |
| Householder who is White alone Map | 5,383 | 1,124,332 | 26,308,077 |
| Householder who is Black or African American alone Map | 707 | 270,115 | 7,868,519 |
| Householder who is American Indian and Alaska Native alone Map | 13 | 5,011 | 430,119 |
| Householder who is Asian alone Map | 13 | 46,856 | 1,943,303 |
| Householder who is Native Hawaiian and Other Pacific Islander alone Map | 0 | 583 | 82,021 |
| Householder who is Some Other Race alone Map | 13 | 51,476 | 2,940,610 |
| Householder who is Two or More Races Map | 106 | 28,809 | 1,157,569 |
| HOUSING UNITS, OCCUPIED, TENURE BY HISPANIC OR LATINO ORIGIN OF HOUSEHOLDER | |||
| Owner occupied: Map | 17,168 | 3,491,722 | 75,986,074 |
| Not Hispanic or Latino householder Map | 17,087 | 3,408,824 | 69,617,625 |
| Hispanic or Latino householder Map | 81 | 82,898 | 6,368,449 |
| Renter occupied: Map | 6,235 | 1,527,182 | 40,730,218 |
| Not Hispanic or Latino householder Map | 6,149 | 1,414,534 | 33,637,301 |
| Hispanic or Latino householder Map | 86 | 112,648 | 7,092,917 |
| HOUSING UNITS, OCCUPIED, TENURE BY HOUSEHOLD SIZE | |||
| Owner occupied: Map | 17,168 | 3,491,722 | 75,986,074 |
| 1-person household Map | 4,101 | 767,169 | 16,453,569 |
| 2-person household Map | 6,620 | 1,304,206 | 27,618,605 |
| 3-person household Map | 2,906 | 596,731 | 12,517,563 |
| 4-person household Map | 2,178 | 499,363 | 10,998,793 |
| 5-person household Map | 915 | 210,370 | 5,057,765 |
| 6-person household Map | 311 | 72,113 | 1,965,796 |
| 7-or-more-person household Map | 137 | 41,770 | 1,373,983 |
| Renter occupied: Map | 6,235 | 1,527,182 | 40,730,218 |
| 1-person household Map | 2,962 | 666,246 | 14,751,340 |
| 2-person household Map | 1,484 | 401,297 | 10,624,023 |
| 3-person household Map | 789 | 207,393 | 6,240,422 |
| 4-person household Map | 536 | 138,079 | 4,626,453 |
| 5-person household Map | 285 | 66,040 | 2,480,866 |
| 6-person household Map | 118 | 27,875 | 1,108,903 |
| 7-or-more-person household Map | 61 | 20,252 | 898,211 |
Loading...