


State Senate District 45, Pennsylvania
About
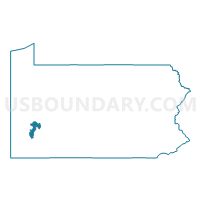
Outline

Summary
| Unique Area Identifier | 201287 |
| Name | State Senate District 45 |
| State | Pennsylvania |
| Area (square miles) | 195.93 |
| Land Area (square miles) | 190.35 |
| Water Area (square miles) | 5.58 |
| % of Land Area | 97.15 |
| % of Water Area | 2.85 |
| Latitude of the Internal Point | 40.44599560 |
| Longtitude of the Internal Point | -79.75084710 |
| Total Population | 220,981 |
| Total Housing Units | 109,141 |
| Total Households | 97,125 |
| Median Age | 44.3 |
Maps
Graphs
Select a template below for downloading or customizing gragh for State Senate District 45, Pennsylvania


Neighbors
Neighoring State Legislative District Upper Chamber (by Name) Neighboring State Legislative District Upper Chamber on the Map
- State Senate District 37, PA
- State Senate District 38, PA
- State Senate District 39, PA
- State Senate District 41, PA
- State Senate District 43, PA
- State Senate District 46, PA
Top 10 Neighboring County (by Population) Neighboring County on the Map
Top 10 Neighboring County Subdivision (by Population) Neighboring County Subdivision on the Map
- Penn Hills township, Allegheny County, PA (42,329)
- North Huntingdon township, Westmoreland County, PA (30,609)
- Monroeville municipality, Allegheny County, PA (28,386)
- Plum borough, Allegheny County, PA (27,126)
- West Mifflin borough, Allegheny County, PA (20,313)
- Murrysville municipality, Westmoreland County, PA (20,079)
- Penn township, Westmoreland County, PA (20,005)
- McKeesport city, Allegheny County, PA (19,731)
- Elizabeth township, Allegheny County, PA (13,271)
- New Kensington city, Westmoreland County, PA (13,116)
Top 10 Neighboring Place (by Population) Neighboring Place on the Map
- Monroeville municipality, PA (28,386)
- Plum borough, PA (27,126)
- West Mifflin borough, PA (20,313)
- Murrysville municipality, PA (20,079)
- McKeesport city, PA (19,731)
- New Kensington city, PA (13,116)
- Lower Burrell city, PA (11,761)
- Munhall borough, PA (11,406)
- Jefferson Hills borough, PA (10,619)
- Swissvale borough, PA (8,983)
Top 10 Neighboring Unified School District (by Population) Neighboring Unified School District on the Map
- Woodland Hills School District, PA (46,882)
- Penn Hills School District, PA (42,423)
- Norwin School District, PA (35,529)
- Gateway School District, PA (31,680)
- McKeesport Area School District, PA (31,150)
- Kiski Area School District, PA (28,857)
- Fox Chapel Area School District, PA (28,727)
- Plum Borough School District, PA (27,126)
- Greensburg Salem School District, PA (26,086)
- Penn-Trafford School District, PA (26,083)
Top 10 Neighboring State Legislative District Lower Chamber (by Population) Neighboring State Legislative District Lower Chamber on the Map
- State House District 30, PA (61,376)
- State House District 55, PA (60,812)
- State House District 56, PA (60,727)
- State House District 54, PA (60,370)
- State House District 58, PA (59,656)
- State House District 57, PA (59,613)
- State House District 33, PA (59,492)
- State House District 25, PA (59,461)
- State House District 39, PA (59,302)
- State House District 38, PA (57,436)
Top 10 Neighboring 111th Congressional District (by Population) Neighboring 111th Congressional District on the Map
- Congressional District 18, PA (653,385)
- Congressional District 4, PA (647,418)
- Congressional District 12, PA (612,384)
- Congressional District 14, PA (584,493)
Top 10 Neighboring Census Tract (by Population) Neighboring Census Tract on the Map
- Census Tract 5261.01, Allegheny County, PA (6,902)
- Census Tract 8019, Westmoreland County, PA (6,623)
- Census Tract 8018, Westmoreland County, PA (6,550)
- Census Tract 8059.02, Westmoreland County, PA (6,387)
- Census Tract 8023.01, Westmoreland County, PA (6,075)
- Census Tract 5030.02, Allegheny County, PA (5,989)
- Census Tract 8033.01, Westmoreland County, PA (5,957)
- Census Tract 4962, Allegheny County, PA (5,812)
- Census Tract 5644, Allegheny County, PA (5,620)
- Census Tract 8012, Westmoreland County, PA (5,537)
Top 10 Neighboring 5-Digit ZIP Code Tabulation Area (by Population) Neighboring 5-Digit ZIP Code Tabulation Area on the Map
- 15642, PA (45,286)
- 15068, PA (38,785)
- 15235, PA (34,580)
- 15221, PA (31,060)
- 15146, PA (28,323)
- 15132, PA (21,472)
- 15239, PA (21,024)
- 15122, PA (20,131)
- 15120, PA (18,931)
- 15147, PA (17,395)
Data
Demographic, Population, Households, and Housing Units
** Data sources from census 2010 **
Show Data on Map
Download Full List as CSV
Download Quick Sheet as CSV
| Subject | This Area | Pennsylvania | National |
|---|---|---|---|
| POPULATION | |||
| Total Population Map | 220,981 | 12,702,379 | 308,745,538 |
| POPULATION, HISPANIC OR LATINO ORIGIN | |||
| Not Hispanic or Latino Map | 218,239 | 11,982,719 | 258,267,944 |
| Hispanic or Latino Map | 2,742 | 719,660 | 50,477,594 |
| POPULATION, RACE | |||
| White alone Map | 182,606 | 10,406,288 | 223,553,265 |
| Black or African American alone Map | 29,659 | 1,377,689 | 38,929,319 |
| American Indian and Alaska Native alone Map | 353 | 26,843 | 2,932,248 |
| Asian alone Map | 2,647 | 349,088 | 14,674,252 |
| Native Hawaiian and Other Pacific Islander alone Map | 48 | 3,653 | 540,013 |
| Some Other Race alone Map | 736 | 300,983 | 19,107,368 |
| Two or More Races Map | 4,932 | 237,835 | 9,009,073 |
| POPULATION, SEX | |||
| Male Map | 104,528 | 6,190,363 | 151,781,326 |
| Female Map | 116,453 | 6,512,016 | 156,964,212 |
| POPULATION, AGE (18 YEARS) | |||
| 18 years and over Map | 175,850 | 9,910,224 | 234,564,071 |
| Under 18 years | 45,131 | 2,792,155 | 74,181,467 |
| POPULATION, AGE | |||
| Under 5 years | 11,998 | 729,538 | 20,201,362 |
| 5 to 9 years | 11,735 | 753,635 | 20,348,657 |
| 10 to 14 years | 12,717 | 791,151 | 20,677,194 |
| 15 to 17 years | 8,681 | 517,831 | 12,954,254 |
| 18 and 19 years | 4,988 | 387,235 | 9,086,089 |
| 20 years | 2,299 | 191,942 | 4,519,129 |
| 21 years | 2,194 | 183,257 | 4,354,294 |
| 22 to 24 years | 7,479 | 498,947 | 12,712,576 |
| 25 to 29 years | 12,774 | 781,527 | 21,101,849 |
| 30 to 34 years | 11,838 | 729,592 | 19,962,099 |
| 35 to 39 years | 12,123 | 764,287 | 20,179,642 |
| 40 to 44 years | 13,661 | 851,382 | 20,890,964 |
| 45 to 49 years | 16,163 | 955,763 | 22,708,591 |
| 50 to 54 years | 18,561 | 984,641 | 22,298,125 |
| 55 to 59 years | 17,078 | 879,048 | 19,664,805 |
| 60 and 61 years | 6,114 | 312,575 | 7,113,727 |
| 62 to 64 years | 8,150 | 430,721 | 9,704,197 |
| 65 and 66 years | 4,339 | 231,623 | 5,319,902 |
| 67 to 69 years | 6,375 | 321,379 | 7,115,361 |
| 70 to 74 years | 8,612 | 426,536 | 9,278,166 |
| 75 to 79 years | 7,983 | 362,332 | 7,317,795 |
| 80 to 84 years | 7,775 | 311,761 | 5,743,327 |
| 85 years and over | 7,344 | 305,676 | 5,493,433 |
| MEDIAN AGE BY SEX | |||
| Both sexes Map | 44.30 | 40.10 | 37.20 |
| Male Map | 42.30 | 38.70 | 35.80 |
| Female Map | 46.00 | 41.50 | 38.50 |
| HOUSEHOLDS | |||
| Total Households Map | 97,125 | 5,018,904 | 116,716,292 |
| HOUSEHOLDS, HOUSEHOLD TYPE | |||
| Family households: Map | 58,944 | 3,261,307 | 77,538,296 |
| Husband-wife family Map | 40,499 | 2,417,765 | 56,510,377 |
| Other family: Map | 18,445 | 843,542 | 21,027,919 |
| Male householder, no wife present Map | 4,471 | 229,495 | 5,777,570 |
| Female householder, no husband present Map | 13,974 | 614,047 | 15,250,349 |
| Nonfamily households: Map | 38,181 | 1,757,597 | 39,177,996 |
| Householder living alone Map | 33,203 | 1,433,415 | 31,204,909 |
| Householder not living alone Map | 4,978 | 324,182 | 7,973,087 |
| HOUSEHOLDS, HISPANIC OR LATINO ORIGIN OF HOUSEHOLDER | |||
| Not Hispanic or Latino householder: Map | 96,258 | 4,823,358 | 103,254,926 |
| Hispanic or Latino householder: Map | 867 | 195,546 | 13,461,366 |
| HOUSEHOLDS, RACE OF HOUSEHOLDER | |||
| Householder who is White alone | 83,094 | 4,264,337 | 89,754,352 |
| Householder who is Black or African American alone | 11,745 | 498,966 | 14,129,983 |
| Householder who is American Indian and Alaska Native alone | 144 | 9,573 | 939,707 |
| Householder who is Asian alone | 918 | 109,060 | 4,632,164 |
| Householder who is Native Hawaiian and Other Pacific Islander alone | 13 | 1,127 | 143,932 |
| Householder who is Some Other Race alone | 186 | 82,237 | 4,916,427 |
| Householder who is Two or More Races | 1,025 | 53,604 | 2,199,727 |
| HOUSEHOLDS, HOUSEHOLD TYPE BY HOUSEHOLD SIZE | |||
| Family households: Map | 58,944 | 3,261,307 | 77,538,296 |
| 2-person household Map | 28,347 | 1,442,819 | 31,882,616 |
| 3-person household Map | 14,441 | 767,169 | 17,765,829 |
| 4-person household Map | 10,074 | 620,755 | 15,214,075 |
| 5-person household Map | 3,995 | 271,611 | 7,411,997 |
| 6-person household Map | 1,400 | 98,268 | 3,026,278 |
| 7-or-more-person household Map | 687 | 60,685 | 2,237,501 |
| Nonfamily households: Map | 38,181 | 1,757,597 | 39,177,996 |
| 1-person household Map | 33,203 | 1,433,415 | 31,204,909 |
| 2-person household Map | 4,447 | 262,684 | 6,360,012 |
| 3-person household Map | 382 | 36,955 | 992,156 |
| 4-person household Map | 103 | 16,687 | 411,171 |
| 5-person household Map | 29 | 4,799 | 126,634 |
| 6-person household Map | 9 | 1,720 | 48,421 |
| 7-or-more-person household Map | 8 | 1,337 | 34,693 |
| HOUSING UNITS | |||
| Total Housing Units Map | 109,141 | 5,567,315 | 131,704,730 |
| HOUSING UNITS, OCCUPANCY STATUS | |||
| Occupied Map | 97,125 | 5,018,904 | 116,716,292 |
| Vacant Map | 12,016 | 548,411 | 14,988,438 |
| HOUSING UNITS, OCCUPIED, TENURE | |||
| Owned with a mortgage or a loan Map | 37,977 | 2,268,674 | 52,979,430 |
| Owned free and clear Map | 26,260 | 1,223,048 | 23,006,644 |
| Renter occupied Map | 32,888 | 1,527,182 | 40,730,218 |
| HOUSING UNITS, VACANT, VACANCY STATUS | |||
| For rent Map | 3,666 | 135,262 | 4,137,567 |
| Rented, not occupied Map | 214 | 9,386 | 206,825 |
| For sale only Map | 1,674 | 64,818 | 1,896,796 |
| Sold, not occupied Map | 491 | 20,131 | 421,032 |
| For seasonal, recreational, or occasional use Map | 342 | 161,582 | 4,649,298 |
| For migrant workers Map | 3 | 411 | 24,161 |
| Other vacant Map | 5,626 | 156,821 | 3,652,759 |
| HOUSING UNITS, OCCUPIED, AVERAGE HOUSEHOLD SIZE BY TENURE | |||
| Total: Map | 2.24 | 2.45 | 2.58 |
| Owner occupied Map | 2.37 | 2.57 | 2.65 |
| Renter occupied Map | 2.00 | 2.16 | 2.44 |
| HOUSING UNITS, OCCUPIED, TENURE BY RACE OF HOUSEHOLDER | |||
| Owner occupied: Map | 64,237 | 3,491,722 | 75,986,074 |
| Householder who is White alone Map | 59,282 | 3,140,005 | 63,446,275 |
| Householder who is Black or African American alone Map | 3,977 | 228,851 | 6,261,464 |
| Householder who is American Indian and Alaska Native alone Map | 54 | 4,562 | 509,588 |
| Householder who is Asian alone Map | 496 | 62,204 | 2,688,861 |
| Householder who is Native Hawaiian and Other Pacific Islander alone Map | 6 | 544 | 61,911 |
| Householder who is Some Other Race alone Map | 61 | 30,761 | 1,975,817 |
| Householder who is Two or More Races Map | 361 | 24,795 | 1,042,158 |
| Renter occupied: Map | 32,888 | 1,527,182 | 40,730,218 |
| Householder who is White alone Map | 23,812 | 1,124,332 | 26,308,077 |
| Householder who is Black or African American alone Map | 7,768 | 270,115 | 7,868,519 |
| Householder who is American Indian and Alaska Native alone Map | 90 | 5,011 | 430,119 |
| Householder who is Asian alone Map | 422 | 46,856 | 1,943,303 |
| Householder who is Native Hawaiian and Other Pacific Islander alone Map | 7 | 583 | 82,021 |
| Householder who is Some Other Race alone Map | 125 | 51,476 | 2,940,610 |
| Householder who is Two or More Races Map | 664 | 28,809 | 1,157,569 |
| HOUSING UNITS, OCCUPIED, TENURE BY HISPANIC OR LATINO ORIGIN OF HOUSEHOLDER | |||
| Owner occupied: Map | 64,237 | 3,491,722 | 75,986,074 |
| Not Hispanic or Latino householder Map | 63,847 | 3,408,824 | 69,617,625 |
| Hispanic or Latino householder Map | 390 | 82,898 | 6,368,449 |
| Renter occupied: Map | 32,888 | 1,527,182 | 40,730,218 |
| Not Hispanic or Latino householder Map | 32,411 | 1,414,534 | 33,637,301 |
| Hispanic or Latino householder Map | 477 | 112,648 | 7,092,917 |
| HOUSING UNITS, OCCUPIED, TENURE BY HOUSEHOLD SIZE | |||
| Owner occupied: Map | 64,237 | 3,491,722 | 75,986,074 |
| 1-person household Map | 17,266 | 767,169 | 16,453,569 |
| 2-person household Map | 24,429 | 1,304,206 | 27,618,605 |
| 3-person household Map | 10,649 | 596,731 | 12,517,563 |
| 4-person household Map | 7,655 | 499,363 | 10,998,793 |
| 5-person household Map | 2,879 | 210,370 | 5,057,765 |
| 6-person household Map | 925 | 72,113 | 1,965,796 |
| 7-or-more-person household Map | 434 | 41,770 | 1,373,983 |
| Renter occupied: Map | 32,888 | 1,527,182 | 40,730,218 |
| 1-person household Map | 15,937 | 666,246 | 14,751,340 |
| 2-person household Map | 8,365 | 401,297 | 10,624,023 |
| 3-person household Map | 4,174 | 207,393 | 6,240,422 |
| 4-person household Map | 2,522 | 138,079 | 4,626,453 |
| 5-person household Map | 1,145 | 66,040 | 2,480,866 |
| 6-person household Map | 484 | 27,875 | 1,108,903 |
| 7-or-more-person household Map | 261 | 20,252 | 898,211 |
Loading...